

1.6 million traders got wiped out (1 year ago)…
Bitcoin recovered in two days. The leveraged traders never got the chance. The DeFi Doctor explains liquidation cascades, and how to read the map yourself. →
October 9, 2026
·
5 Min Read



The briefing serious investors read first.
Free analysis before markets open. Start thinking in decades, not days.
Join 45,000+ readers · No spam · Unsubscribe anytime · No card needed
Today’s Big Picture
One year ago tomorrow, late on the afternoon of Oct. 10th, President Trump posted that he would add a 100% tariff on Chinese imports.
Over the next 24 hours, digital asset exchanges recorded more than $19 billion in forced liquidations, the largest ever. More than 1.6 million traders were closed out.
Tan Gera marked the anniversary of Bitcoin’s record high on Tuesday. Four days after that peak came the day that decided who would still be around for the rest of the year.
Bitcoin fell about 14.5% in a matter of hours. Anyone who owned it outright had a bad weekend, and by Sunday it was back above $114,000.
Bitcoin recovered in two days. The leveraged traders never got the chance.
A year later, leverage is building again, though at a cooler pace. More than $1.1 billion in positions were liquidated in the 24 hours to Thursday afternoon.
Below, The DeFi Doctor explains how a liquidation cascade works, and how to read the free map that shows where the next one could start.
Paid Advertisement
Elon Filed Something With the FCC. Then Said Nothing.
No announcement. No tweet. From the loudest man in tech, silence is the signal. James Altucher read the filing, and says what's inside is bigger than Tesla, SpaceX, and X combined, because it solves the one problem holding back the $25 trillion AI race.
His free masterclass breaks down the filing, the plan, and the tickers.
Disclosure: Paradigm Press is a paid partner of Future Finance. The forecasts and claims above are James Altucher's / Paradigm's, not Future Finance research or advice. As always, do your own diligence.
Signal vs. Noise
The 30-Year Sold at a 2000 Yield
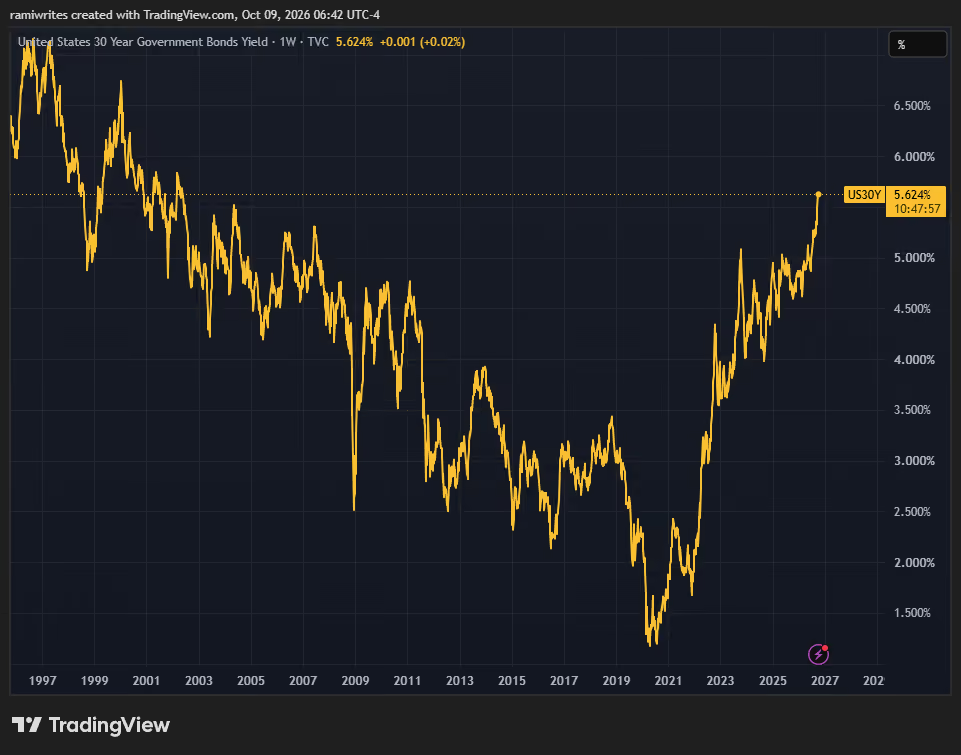
- The noise: the Treasury sold $22 billion of 30-year bonds Thursday at 5.618%, the highest auction yield since August 2000.
- The signal: buyers showed up at that price. Bids came in at 2.54 times the amount on offer, above the recent average of 2.41, and dealers were left with 6.8% against an average near 10%.
That makes two solid long-bond auctions in two days, after Wednesday’s strong 10-year sale. The message is consistent: investors will lend the government money for decades, as long as they’re paid well over 5% to do it.
For beginners: that steady demand keeps long-term rates high without letting them spike. It’s good news for anyone buying bonds, and a reason mortgage rates near 7.3% aren’t going anywhere soon.
PepsiCo Cut Prices, Then Cut Its Outlook
- The noise: PepsiCo beat estimates Thursday, earning $2.34 a share against $2.29 expected, and the stock rose about 3.7%.
- The signal: the forecast underneath. PepsiCo lowered its full-year profit-growth outlook to 2.5% to 3.5%, after cutting prices on Lay’s and Doritos by up to 15% to win shoppers back.
On Wednesday, Frank Curzio argued that this earnings season would be decided by guidance. The first big consumer company to report kept its sales outlook and trimmed its profit outlook.
That’s a company choosing customers over margins. When shoppers push back on prices, profits are usually what gives first. Watch for the same trade-off from the airlines and restaurants reporting over the next few weeks.
Bitcoin Funds Had Their Worst Day Since June
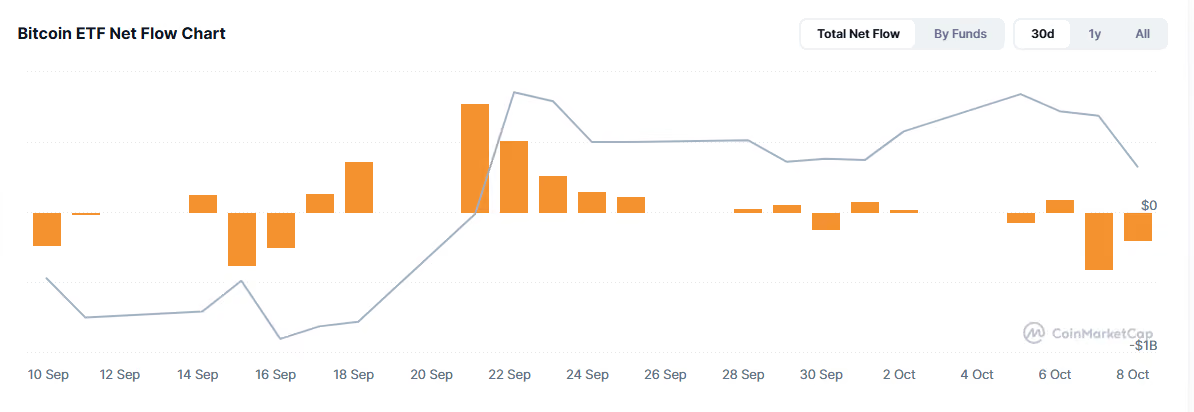
- The noise: U.S. spot Bitcoin funds lost about $485 million on Wednesday, their biggest one-day outflow since June 25, and another $244 million on Thursday.
- The signal: the longer view. JPMorgan analysts estimate digital asset inflows are running at an annualized pace of about $66 billion, up from $52 billion in May.
They also note that cumulative fund flows are still negative when measured from October 10, 2025, the day of the cascade. A year on, the money that left that weekend still hasn’t fully come back.
For beginners: two bad days in a market paying 5% on Treasurys don’t make a trend. The level analysts are watching is $80,000 to $82,000, close to where Bitcoin trades now.

Featured Contributor
Today’s guest is The DeFi Doctor, owner and author of Beat Banks, a twice-weekly intelligence briefing on where real yield opportunities exist in decentralized finance. This piece is educational. Leverage can lose you more than you expect, and nothing here is a recommendation.
The Dominoes of October 10, 2025
Late on Friday, October 10, 2025, after U.S. stock markets had closed for the weekend, a tariff post hit the wires. Within 40 minutes, digital assets had their worst stretch on record.
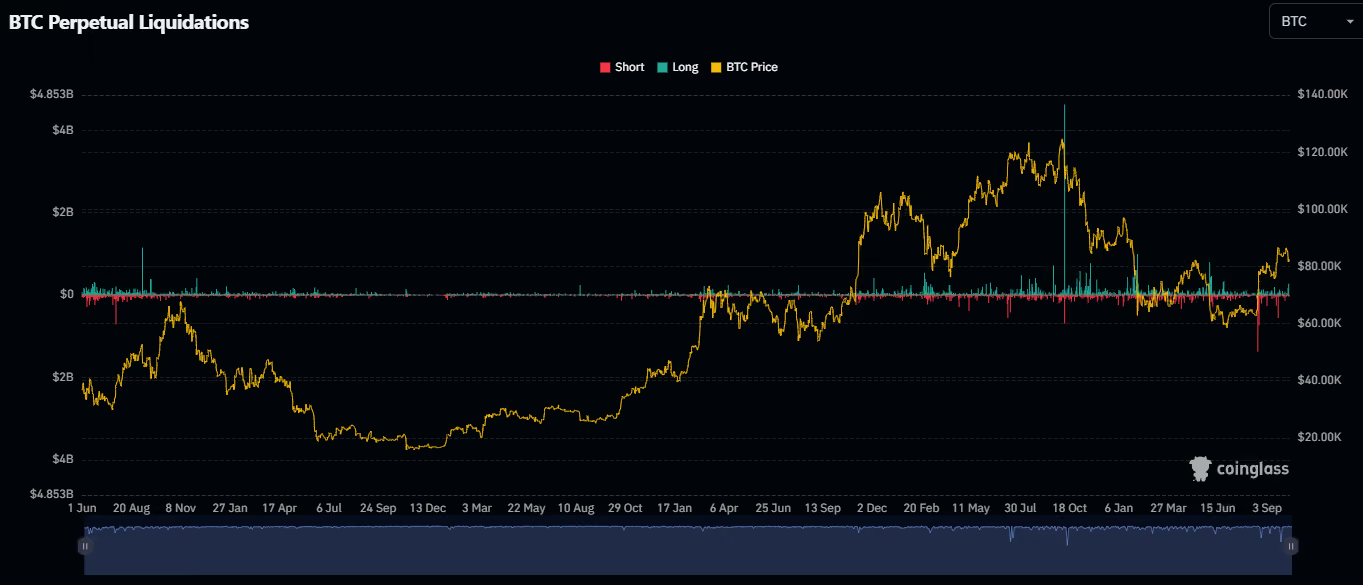
Over the next 24 hours, exchanges recorded more than $19 billion in forced liquidations across more than 1.6 million traders. Bitcoin fell from about $122,500 to about $104,800.
If you owned your Bitcoin outright, you had a rough weekend. By Sunday it was back above $114,000.
If you had borrowed to buy it, there was no Sunday. Here’s how that happens, and how to see where it could happen next.
Leverage in one paragraph
Leverage means borrowing to control a bigger position than your cash covers. Put up $1,000 at 10x, and you control $10,000 of Bitcoin.
The exchange lends you the rest, and it wants that loan protected. So it sets a liquidation price: the level where your cushion is nearly gone and it closes your position automatically.
With Bitcoin at $82,000, a 10x long gets liquidated near $74,200. That’s a drop of about 9.5%. On October 10, Bitcoin fell about 14.5%.
Roughly how far the price can move against you before you’re closed out, before fees:
- 2x: about 49.5%
- 5x: about 19.5%
- 10x: about 9.5%
- 20x: about 4.5%
- 50x: about 1.5%
- 100x: under 1%
Exact numbers vary by exchange, fees and position size.
Why the dominoes fall
A liquidation is a forced sale, made at whatever price the market offers. When the market is thin, that sale pushes the price down.
The lower price hits the next trader’s liquidation level, which forces another sale, which pushes the price lower again. That’s the cascade.
Think of a row of dominoes, where the gap between them is how many buyers are waiting. On October 10, the buyers vanished. Visible order-book depth fell about 98% as market makers pulled their quotes, and the dominoes were nearly touching.
About 85% to 90% of the positions wiped out were bets that prices would rise. Most of the damage landed in a 40-minute window on a Friday evening, with stock and bond markets closed and nobody else to absorb the selling.
What made it worse
Two things turned a bad hour into a record.
The first was collateral. On Binance, some traders backed their bets with tokens like USDe, a dollar-pegged token, using one account-wide pool of collateral.
USDe briefly traded at about 66 cents on Binance while holding near $1 elsewhere, and accounts were liquidated on that price. Binance later paid out $283 million in compensation.
The second was auto-deleveraging. When an exchange can’t sell a failing position fast enough, it can force-close profitable positions on the other side to cover the gap.
Think of an overbooked flight: first the airline asks for volunteers, and when nobody steps up, it bumps the biggest seat-holders. On October 10, even some of the winners got bumped.
Two caveats about the $19 billion
It’s probably too low. Some exchanges report only a slice of their liquidations, and CoinGlass, the firm behind the headline figure, has since estimated the real total was likely $30 billion to $40 billion.
It also measures the size of the positions closed. The cash traders lost was far smaller, with estimates closer to $1 billion to $3 billion.
The year since
Bitcoin never got back to its October 6 record of about $126,200. It bottomed near $58,000 in early July and trades around $82,700 today.
Leverage is creeping back. Open interest, the value of all open futures bets on Bitcoin, rose about 4% in a week, almost matching the 4.1% rise before last year’s crash.
The difference is the price of those bets. A year ago, traders were paying about 30% a year to hold leveraged longs. Today that cost is roughly flat, which tells you the crowd is less crowded.
How to read a liquidation heatmap
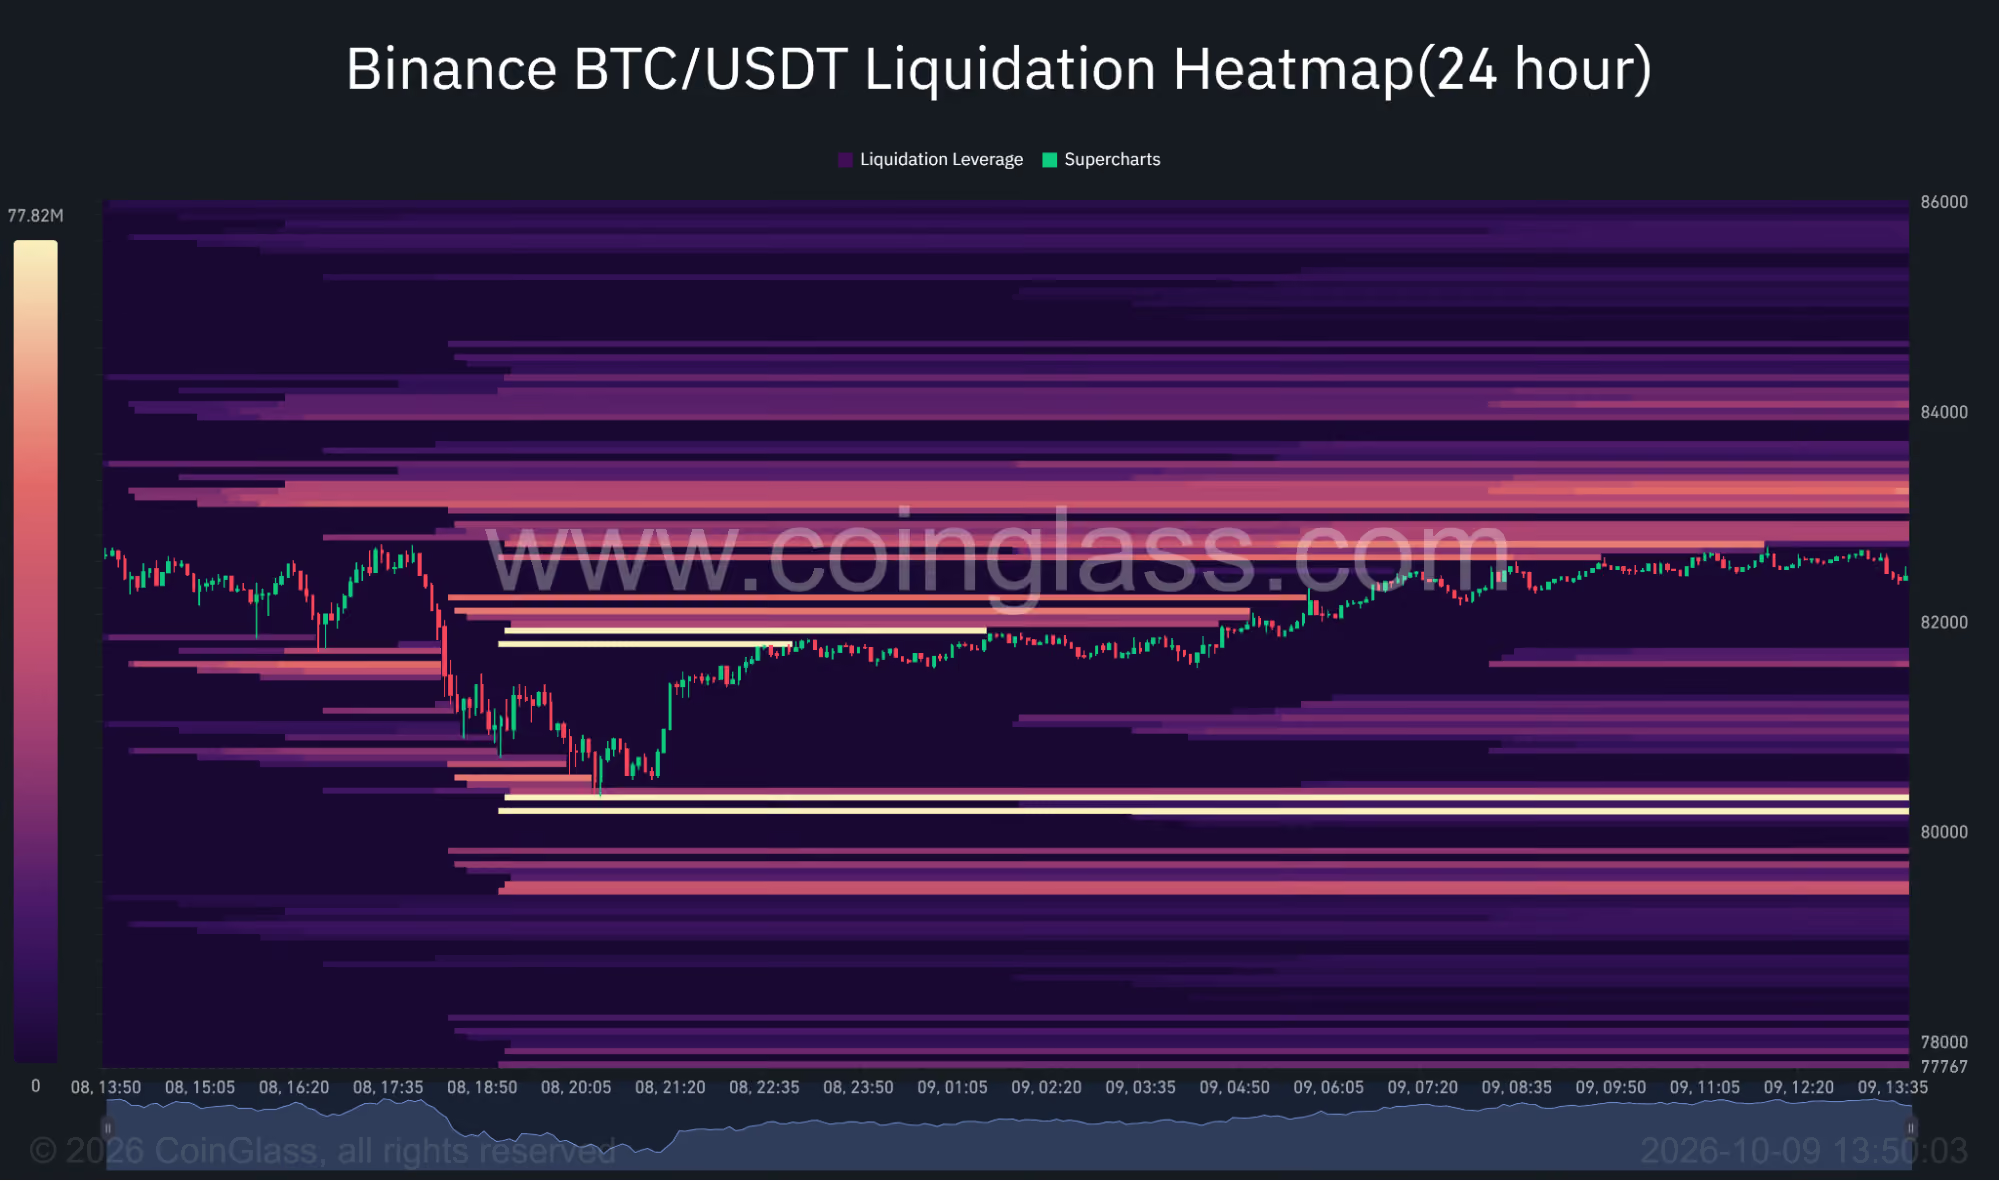
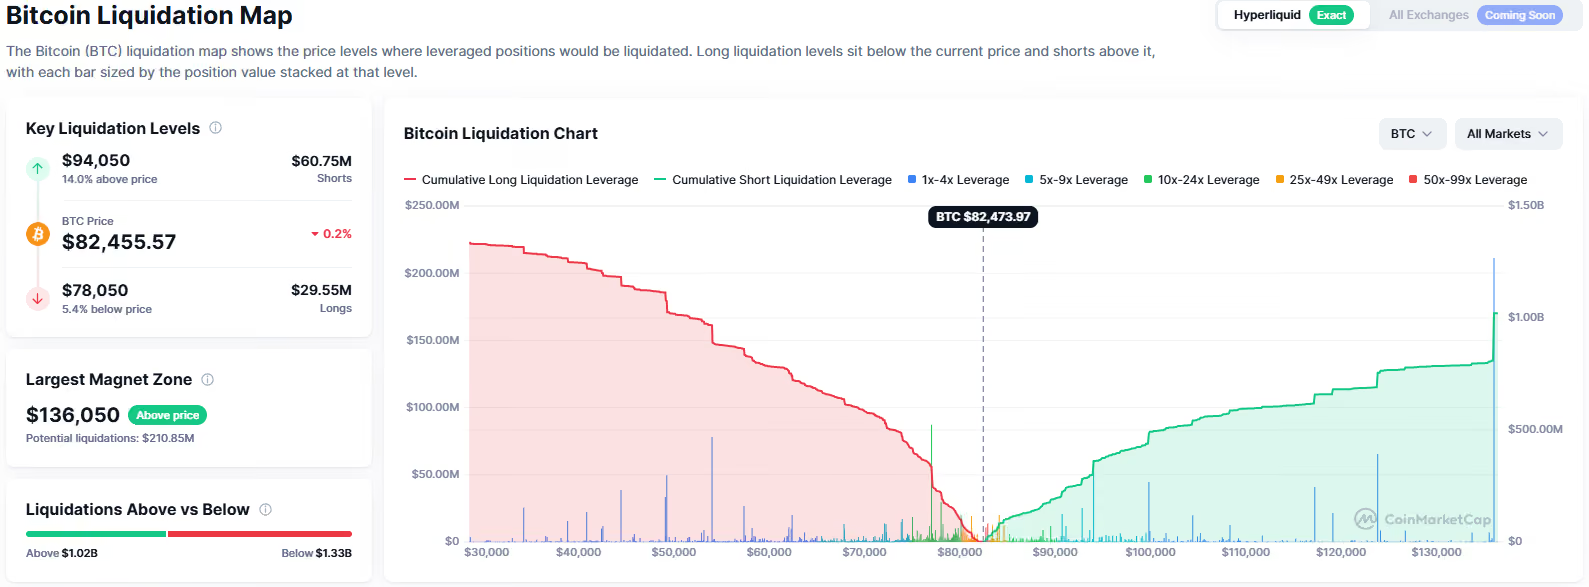
You don’t have to guess where the dominoes stand. A liquidation heatmap estimates where leveraged positions would be forced to close, and the basic version is free.
- Open it. On CoinGlass, go to Futures, then Liquidation Heatmap. Choose BTC.
- Pick a timeframe. Start with 24 hours for nearby levels, then switch to a week or a month for the bigger clusters.
- Find the price. Price runs up the side and time across the bottom.
- Read the colors. Purple means little estimated liquidation. Bright yellow bands are the biggest clusters.
- Read the side. Bands below the price are longs that get forced to sell on a drop. Bands above are shorts that get forced to buy on a rise.
- Check the fuel. Rising open interest and strongly positive funding mean more leverage stacked behind those bands.
Right now, analysts flag $82,000 to $82,500 as a liquidation zone, with $80,000 the next level if it breaks. That’s close to where Bitcoin sits today.
A heatmap is a weather map, never a crystal ball.
It’s built from estimates, the bands move as traders open and close positions, and the price doesn’t have to visit any of them. Use it to see where the crowd is exposed, and to keep your own exposure somewhere else.
What I’d take from it
Spot holders can’t be liquidated. If you own the asset outright, a crash is a loss on paper you can wait out.
If you use leverage, know your liquidation price before you place the trade, keep it away from the bright bands, and keep each bet’s collateral separate so one bad position can’t take the account.
Most of what I write in Beat Banks comes back to that idea: earning a return on assets you own outright, so a bad Friday costs you some value and never forces a sale.
October 10 was the same asset on the same day for everyone. What decided who was still standing on Sunday was how much each person had borrowed on Friday.
- The DeFi Doctor
Author, Beat Banks
If The Dollar Is Being Debased, Where Do You Put Your Money?
If governments keep spending and the dollar keeps losing value over time, holding all your savings in cash is a slow leak.
One answer is to earn a real return that outpaces the debasement, on your own terms, instead of letting a bank pay you next to nothing on your deposits.
That is the whole idea behind Beat Banks, the weekly research on becoming your own bank and taking control of your financial destiny.
The dollar is designed to lose value over time. This is about making your money do the opposite.
See how it works right here…
Final Thought
Most crashes get remembered by how far the price fell. October 10 is worth remembering for who it fell on.
Two people could have owned the same Bitcoin that Friday. One woke up Sunday down a little. The other woke up with nothing, because of a decision made before the post ever went out.
The lesson travels well beyond digital assets: your risk is set before the bad day, never during it.
Delta reported before the bell this morning, and its forecast goes next to PepsiCo’s in tomorrow’s weekly recap. On Sunday, the first edition of The Earnings Ahead previews the big banks.
Have a good weekend.
Editor in Chief | Future Finance
One Subscription. The Entire Gems Uncovered Research Library.

You just read why the surface of the news rarely tells the whole story.
Gems Uncovered is built on that same principle. It's our weekly research briefing on early-stage assets and native market access, the opportunities that build real wealth before they ever reach a mainstream exchange.
One level beneath the headlines is where the edge lives.
Subscribe to Gems Uncovered →
Disclaimer: This content is not financial advice, it is for informational purposes only. All investments involve inherent risk. Any financial decisions you make are solely your responsibility.
Latest



Editor's Picks

Become a sharper capital allocator in 5 minutes a day.
Institutional-grade research on where the smartest capital is positioning, across AI, energy, biotech, robotics, and digital assets. Distilled into a daily read you finish before your coffee does.
Join 45,000+ readers · No spam · Unsubscribe anytime · No card needed