

The election chart that will fool you Wednesday
And the pattern that’s held 19 for 19 →
November 2, 2026
·
5 Min Read



The briefing serious investors read first.
Free analysis before markets open. Start thinking in decades, not days.
Join 45,000+ readers · No spam · Unsubscribe anytime · No card needed
Today’s Big Picture
By Wednesday morning, someone will share a chart showing that the election result is great for stocks.
Someone else will share a chart showing it’s terrible.
Both charts will probably use real data.
Americans vote tomorrow. Prediction markets price Democrats as heavy favorites for the House, at about 94%, and as favorites for the Senate, at about 72%.
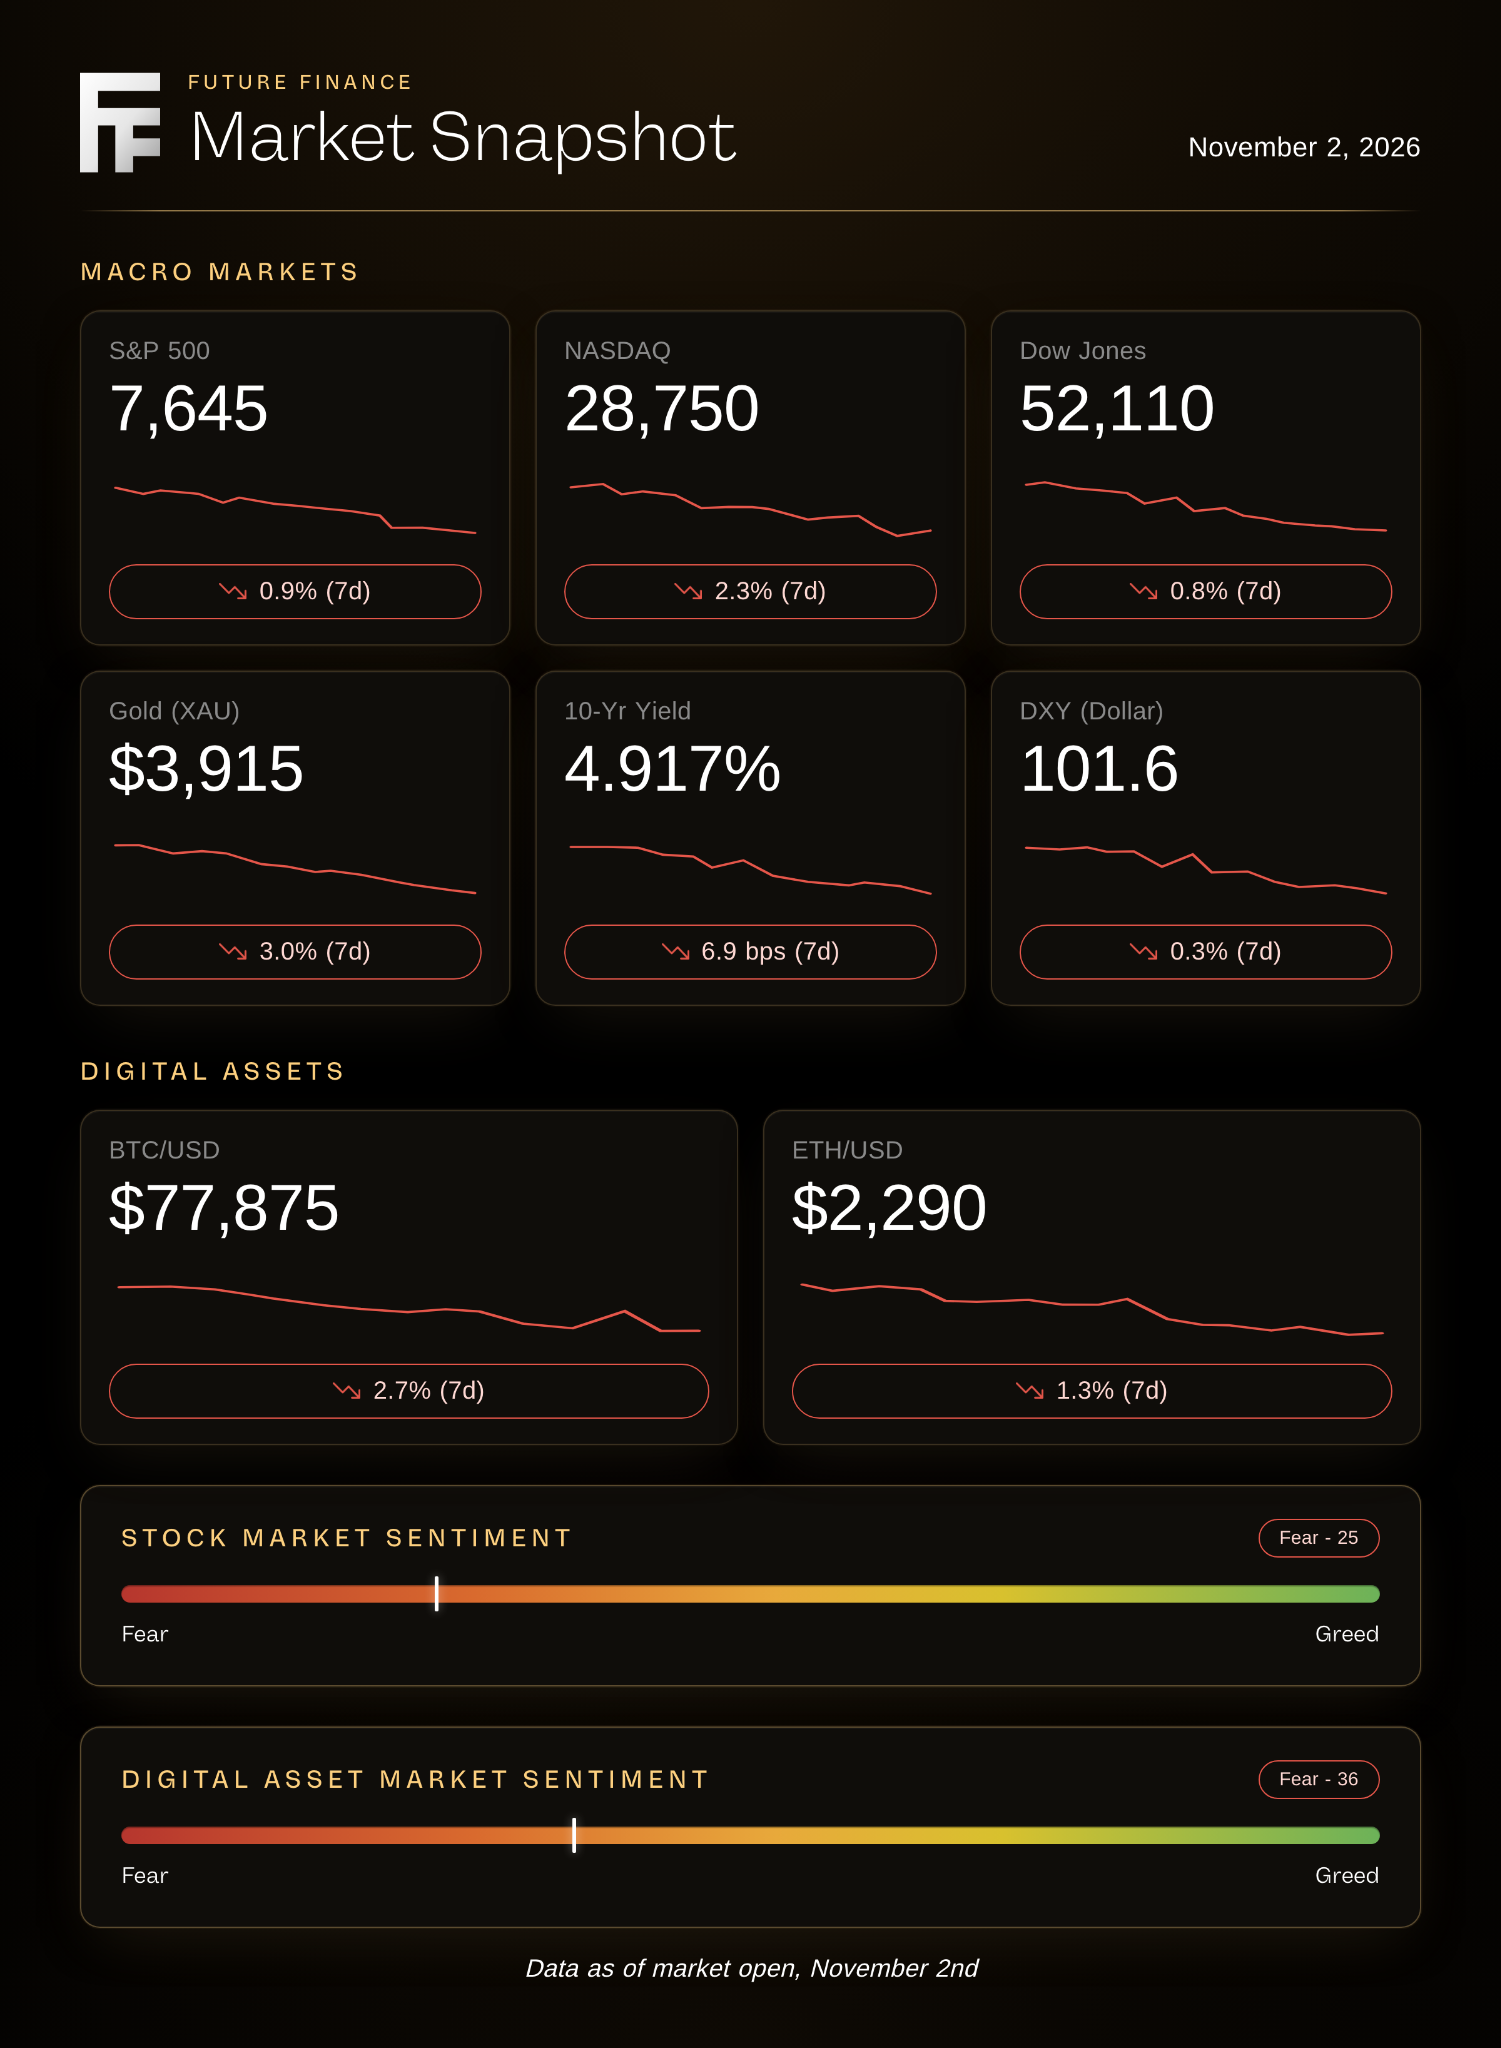
Stocks head into the vote off their worst day since June. The S&P 500 closed Friday at 7,580, about 3% below its October record.
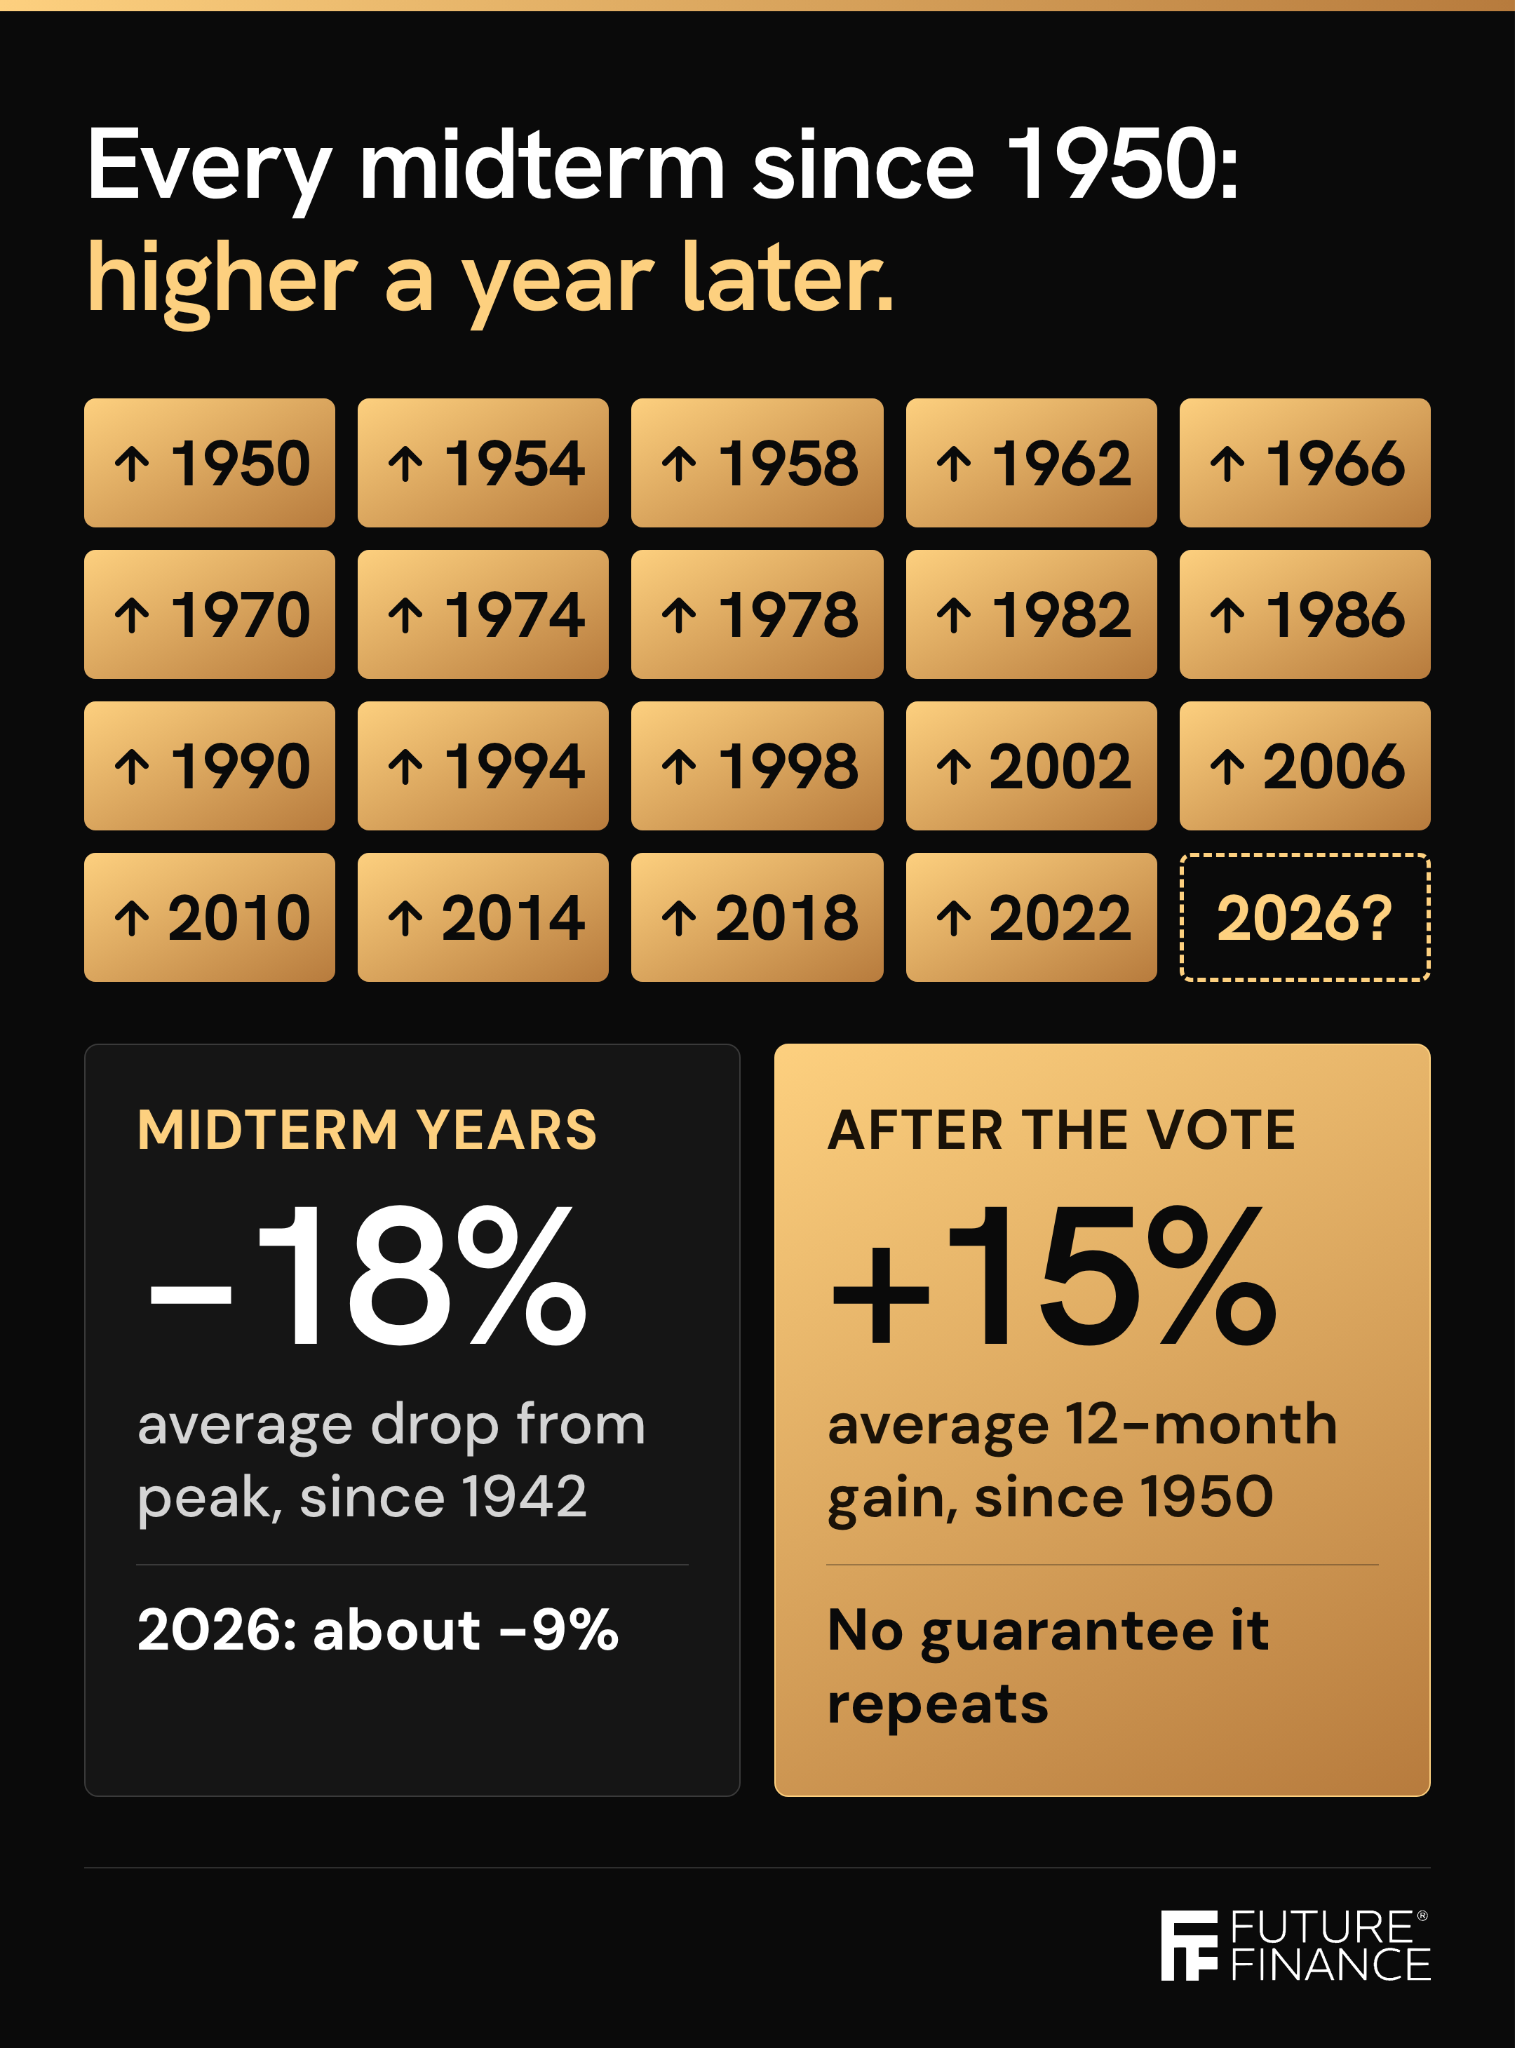
History has a lot to say about what comes next. Most of it is about the calendar. Since 1950, the S&P 500 has been higher 12 months after every midterm election, 19 out of 19.
For stocks, when the election happens has mattered more than who wins it.
Below, I walk through every possible outcome tomorrow and what history says about each one.
Paid Advertisement
Your Savings Account Pays 0.4%. Last Week’s Stablecoin Pools Paid About 7%.
Tomorrow decides who runs Congress. It won’t change what your bank pays you.
The average U.S. savings account pays about 0.4%, according to the FDIC.
Here’s what last Tuesday’s issue of Beat Banks found instead, as of Oct. 27:
- Low risk: two pools of dollar stablecoins paying about 7% a year from trading fees alone. That’s about 19 cents a day on every $1,000.
- Medium risk: a pool pairing HYPE, the token of the futures exchange Hyperliquid, with dollars, at about 90%.
- High risk: a pool pairing a token that tracks the S&P 500 with ETH, at about 143%, paid in AERO tokens.
Beat Banks is Decentralized Masters’ twice-weekly research newsletter from The DeFi Doctor. Every pool comes with a risk scorecard, the range Doc would use, where the yield comes from and what it means in dollars a day.
Tuesday’s issue lays out six pools across three risk levels, each with a link to set it up. Thursday’s explains what’s moving and why.
Higher yields come with bigger risks, and Doc spells those out too, from price swings to the chance of losing money.
Yields are as of Oct. 27, 2026, change daily and are not guaranteed. Decentralized finance carries risks, including smart-contract failures, stablecoin depegs and the loss of principal. Nothing here is a recommendation.
Signal vs. Noise
The Senate Race Isn’t a Coin Flip Anymore
- The noise: “Senate control is too close to call.”
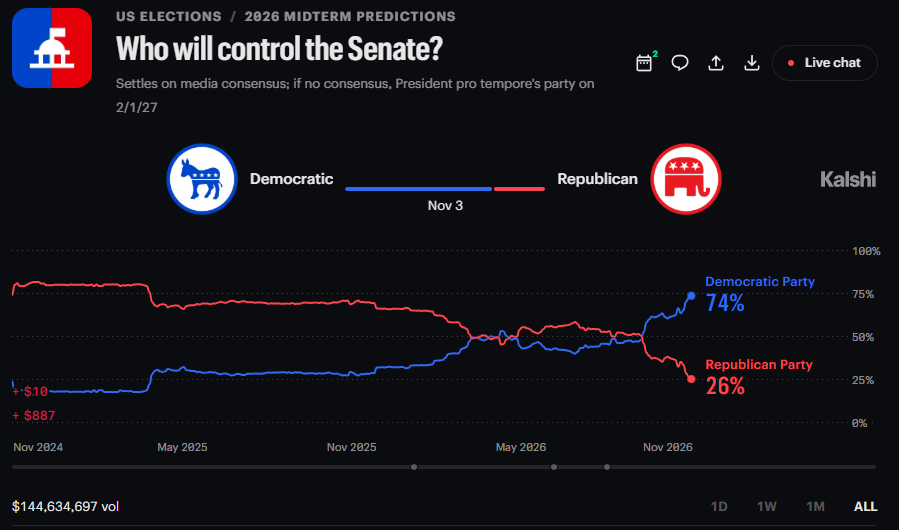
- The signal: prediction markets have moved a long way. On Kalshi, Republicans led the Senate market 56% to 44% in March. Democrats took the lead in mid-September and reached about 71% by Sunday.
The House has been less of a contest. Traders give Democrats about 94% there.
Put the two chambers together, and traders price three outcomes:
- Democrats win both chambers: about 71%
- Democrats win the House, Republicans keep the Senate: about 25%
- Republicans keep both chambers: about 6%
Odds aren’t results. This year alone, Kalshi gave single-digit chances to two primary candidates who went on to win.
For beginners: a 72% chance still means the other side wins about 1 time in 4. Tomorrow, we’ll explain how these markets work, and why a platform built on digital assets, Polymarket, keeps showing up on cable news.
Friday’s Drop Came From Tech, Not Politics
- The noise: stocks are nervous about the election.
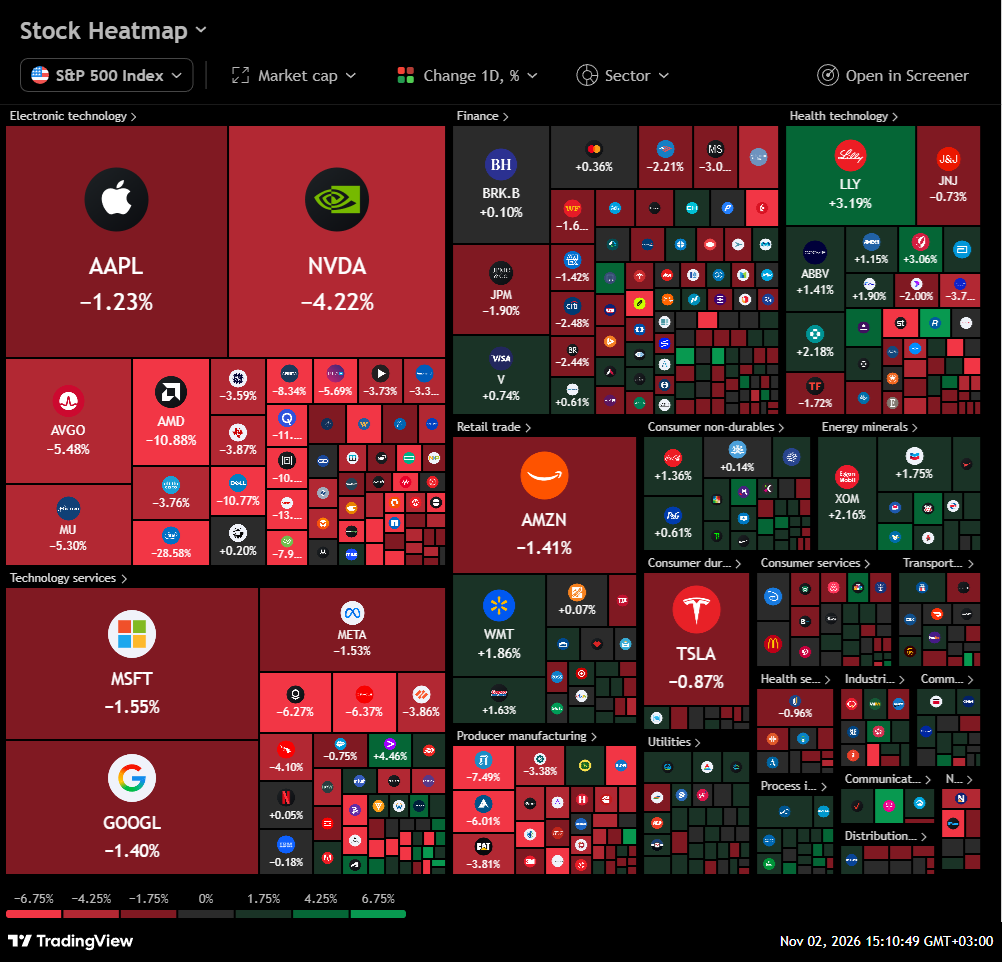
- The signal: the selling came from AI spending worries. The S&P 500 fell 1.8% Friday, its worst day since June, and the Nasdaq fell 2.9%. Intel dropped about 29% after its earnings.
That followed Amazon’s and Alphabet’s spending reports earlier in the week. The Nasdaq finished October down about 5%, its worst month since March 2025.
Even so, the S&P 500 is still up 10.7% for 2026. Apple reports after today’s close, with Wall Street expecting about $113 billion in revenue.
For beginners: when stocks fall the week before an election, it’s tempting to blame the vote. Check what moved first. Friday, it was earnings.
Binance Reopens Withdrawals

- The noise: the $6.3 billion hack is behind us.
- The signal: the cleanup has just started. The FBI attributed Thursday’s theft to North Korea’s “TraderTraitor” hacking unit.
Binance began reopening withdrawals Sunday in phases, starting with Bitcoin and 14 other assets. Blockchain analysts expect the hackers to launder what they still hold through smaller exchanges over months.
For beginners: stolen digital assets don’t vanish. They sit in wallets anyone can watch, and when they’re sold, that selling hits the market.
Featured Lead

Today’s Featured Lead comes from me, Rami Al-Sabeq, Editor in Chief of Future Finance. I’ve written about digital assets and markets since 2020, and I oversee every newsletter at Decentralized Masters, including Gems Uncovered, Beat Banks and The Macro Letter. Nothing below takes a political side, and nothing here is a recommendation.
Three Possible Outcomes Tomorrow. One Pattern That Has Held Since 1950.
Here’s a number you might see this week.
When a Republican president faces a Democratic Congress, stocks have averaged just 4.9% a year. CFRA, Truist and Dow Jones Market Data all find it, in data going back to the 1930s and ’40s.
Here’s another. In the 12 months after a midterm that left a Republican president with a divided government, stocks averaged 18%, according to The Motley Fool’s study of data back to 1874.
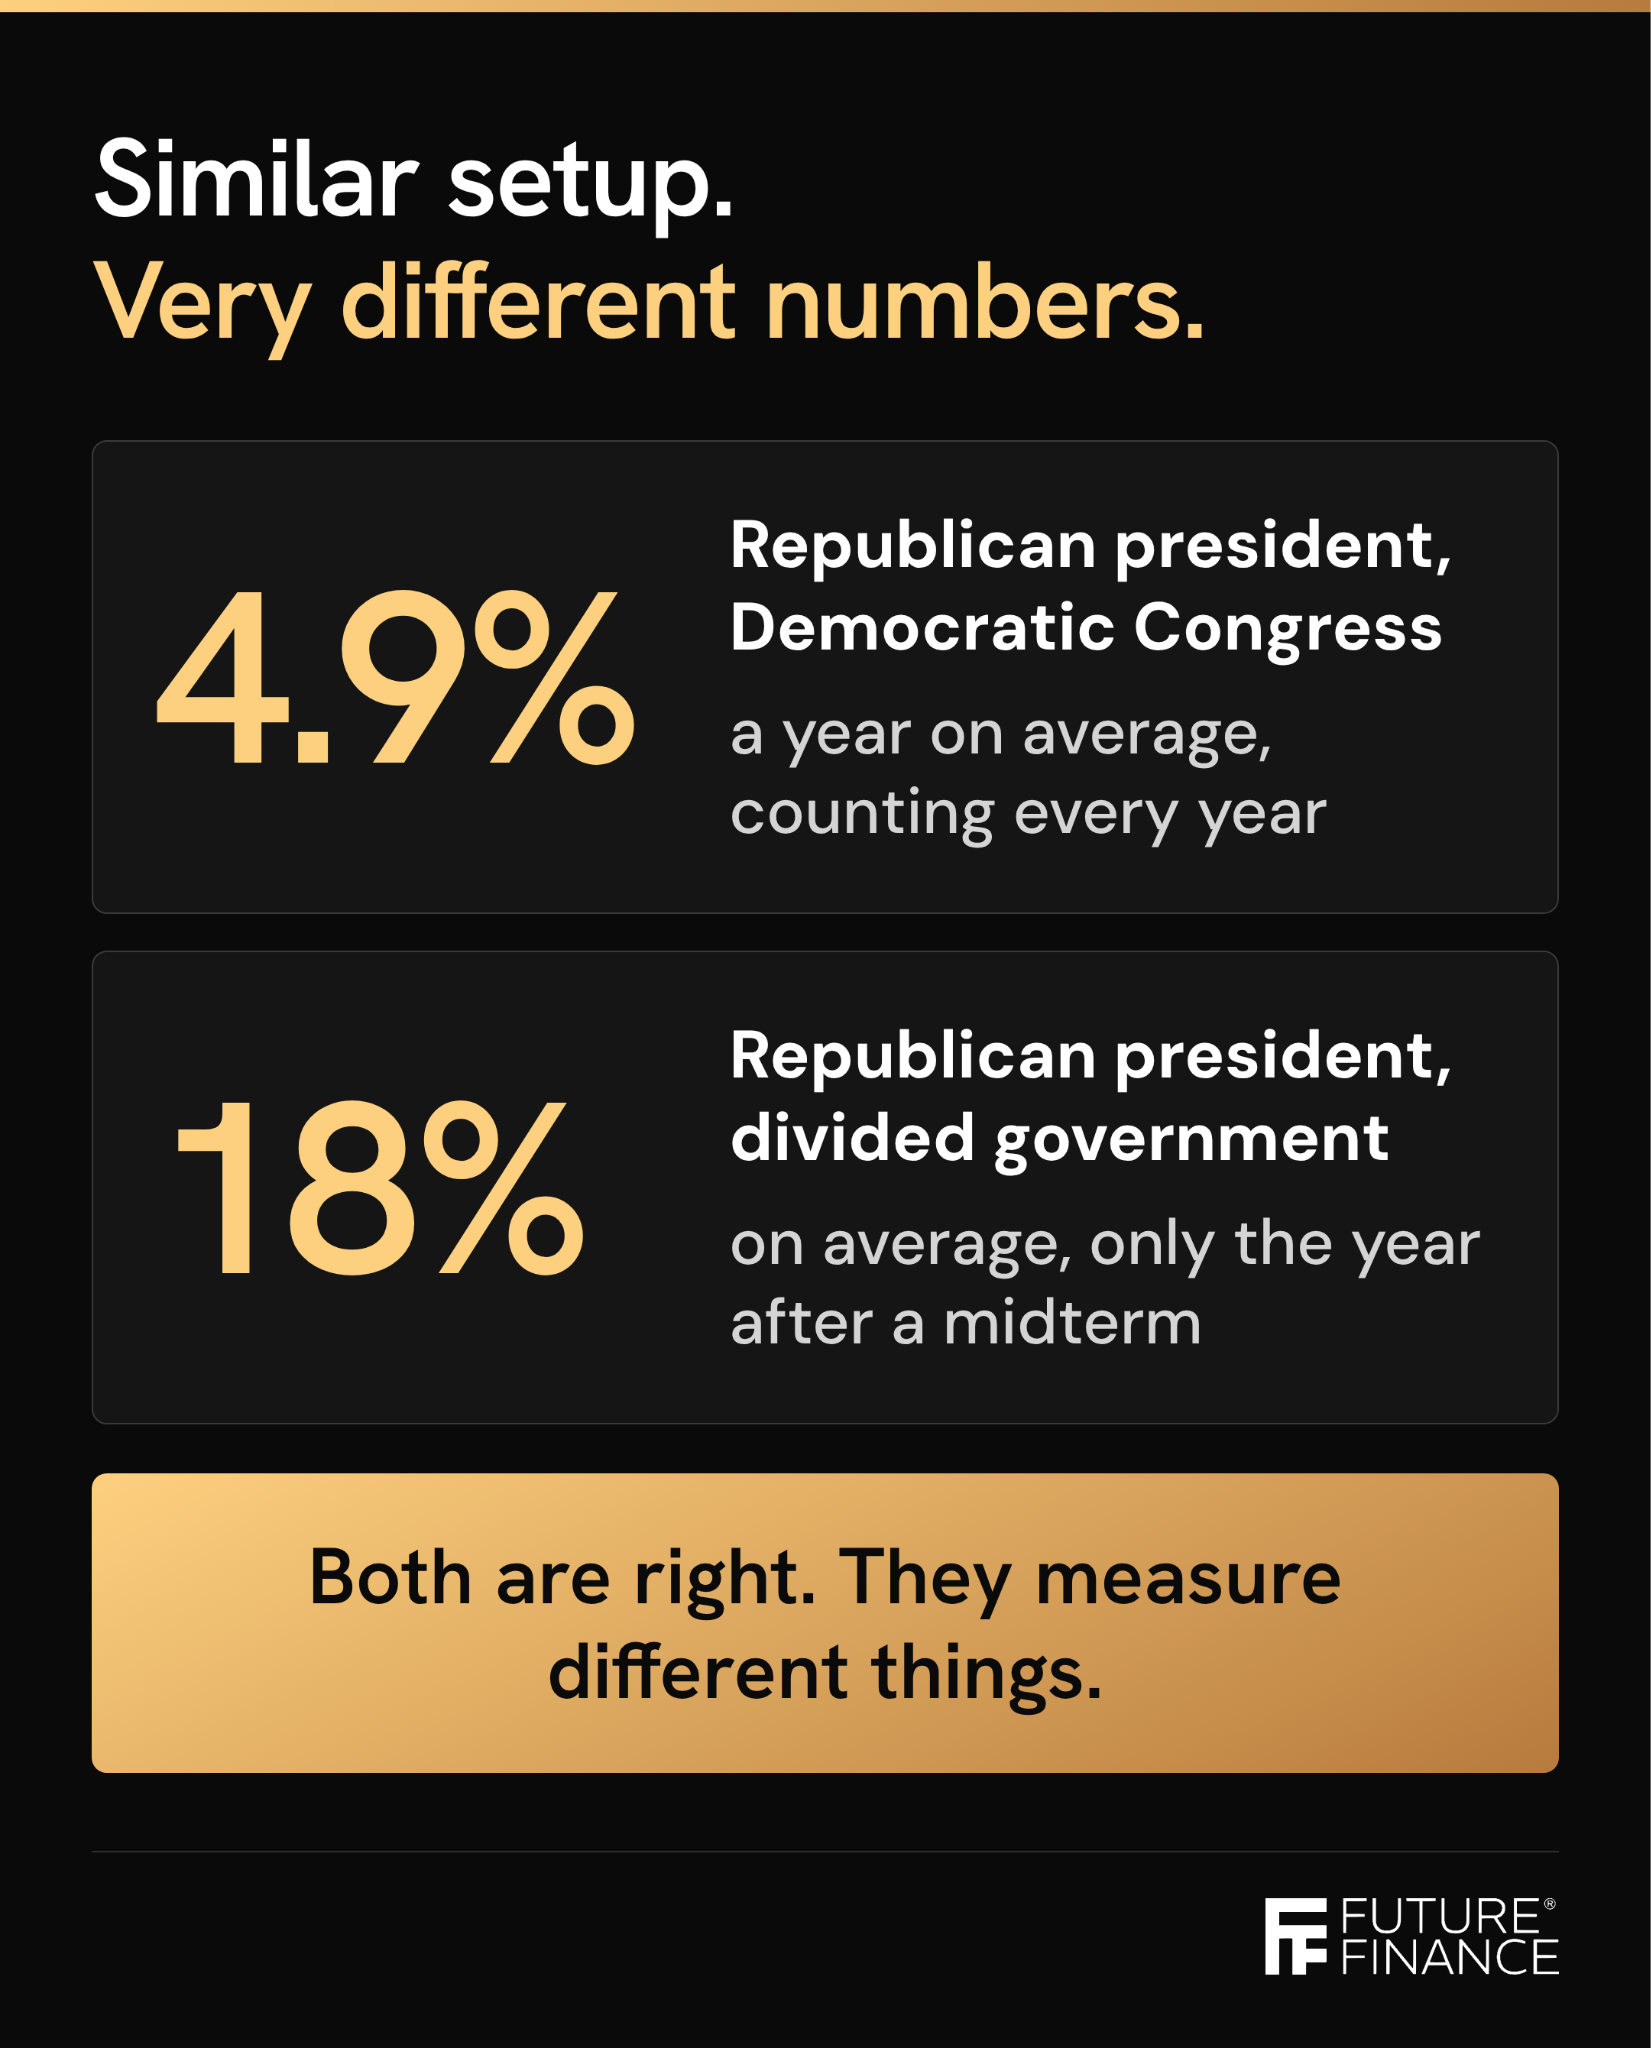
Similar arrangement in Washington. One study puts it near the bottom, the other near the top.
Both are right, because they measure different things. The first counts every calendar year with that setup, including the 1973–74 bear market and the 2008 financial crisis. The second counts only the year right after a midterm, historically one of the strongest stretches of the four-year presidential cycle.
When one arrangement can rank near the bottom and near the top, the arrangement probably isn’t what’s driving returns.
What markets are pricing
Tomorrow’s vote leaves three realistic outcomes. Prediction markets price a Democratic sweep of Congress at about 71%, a split Congress at about 25% and Republicans keeping both chambers at about 6%.
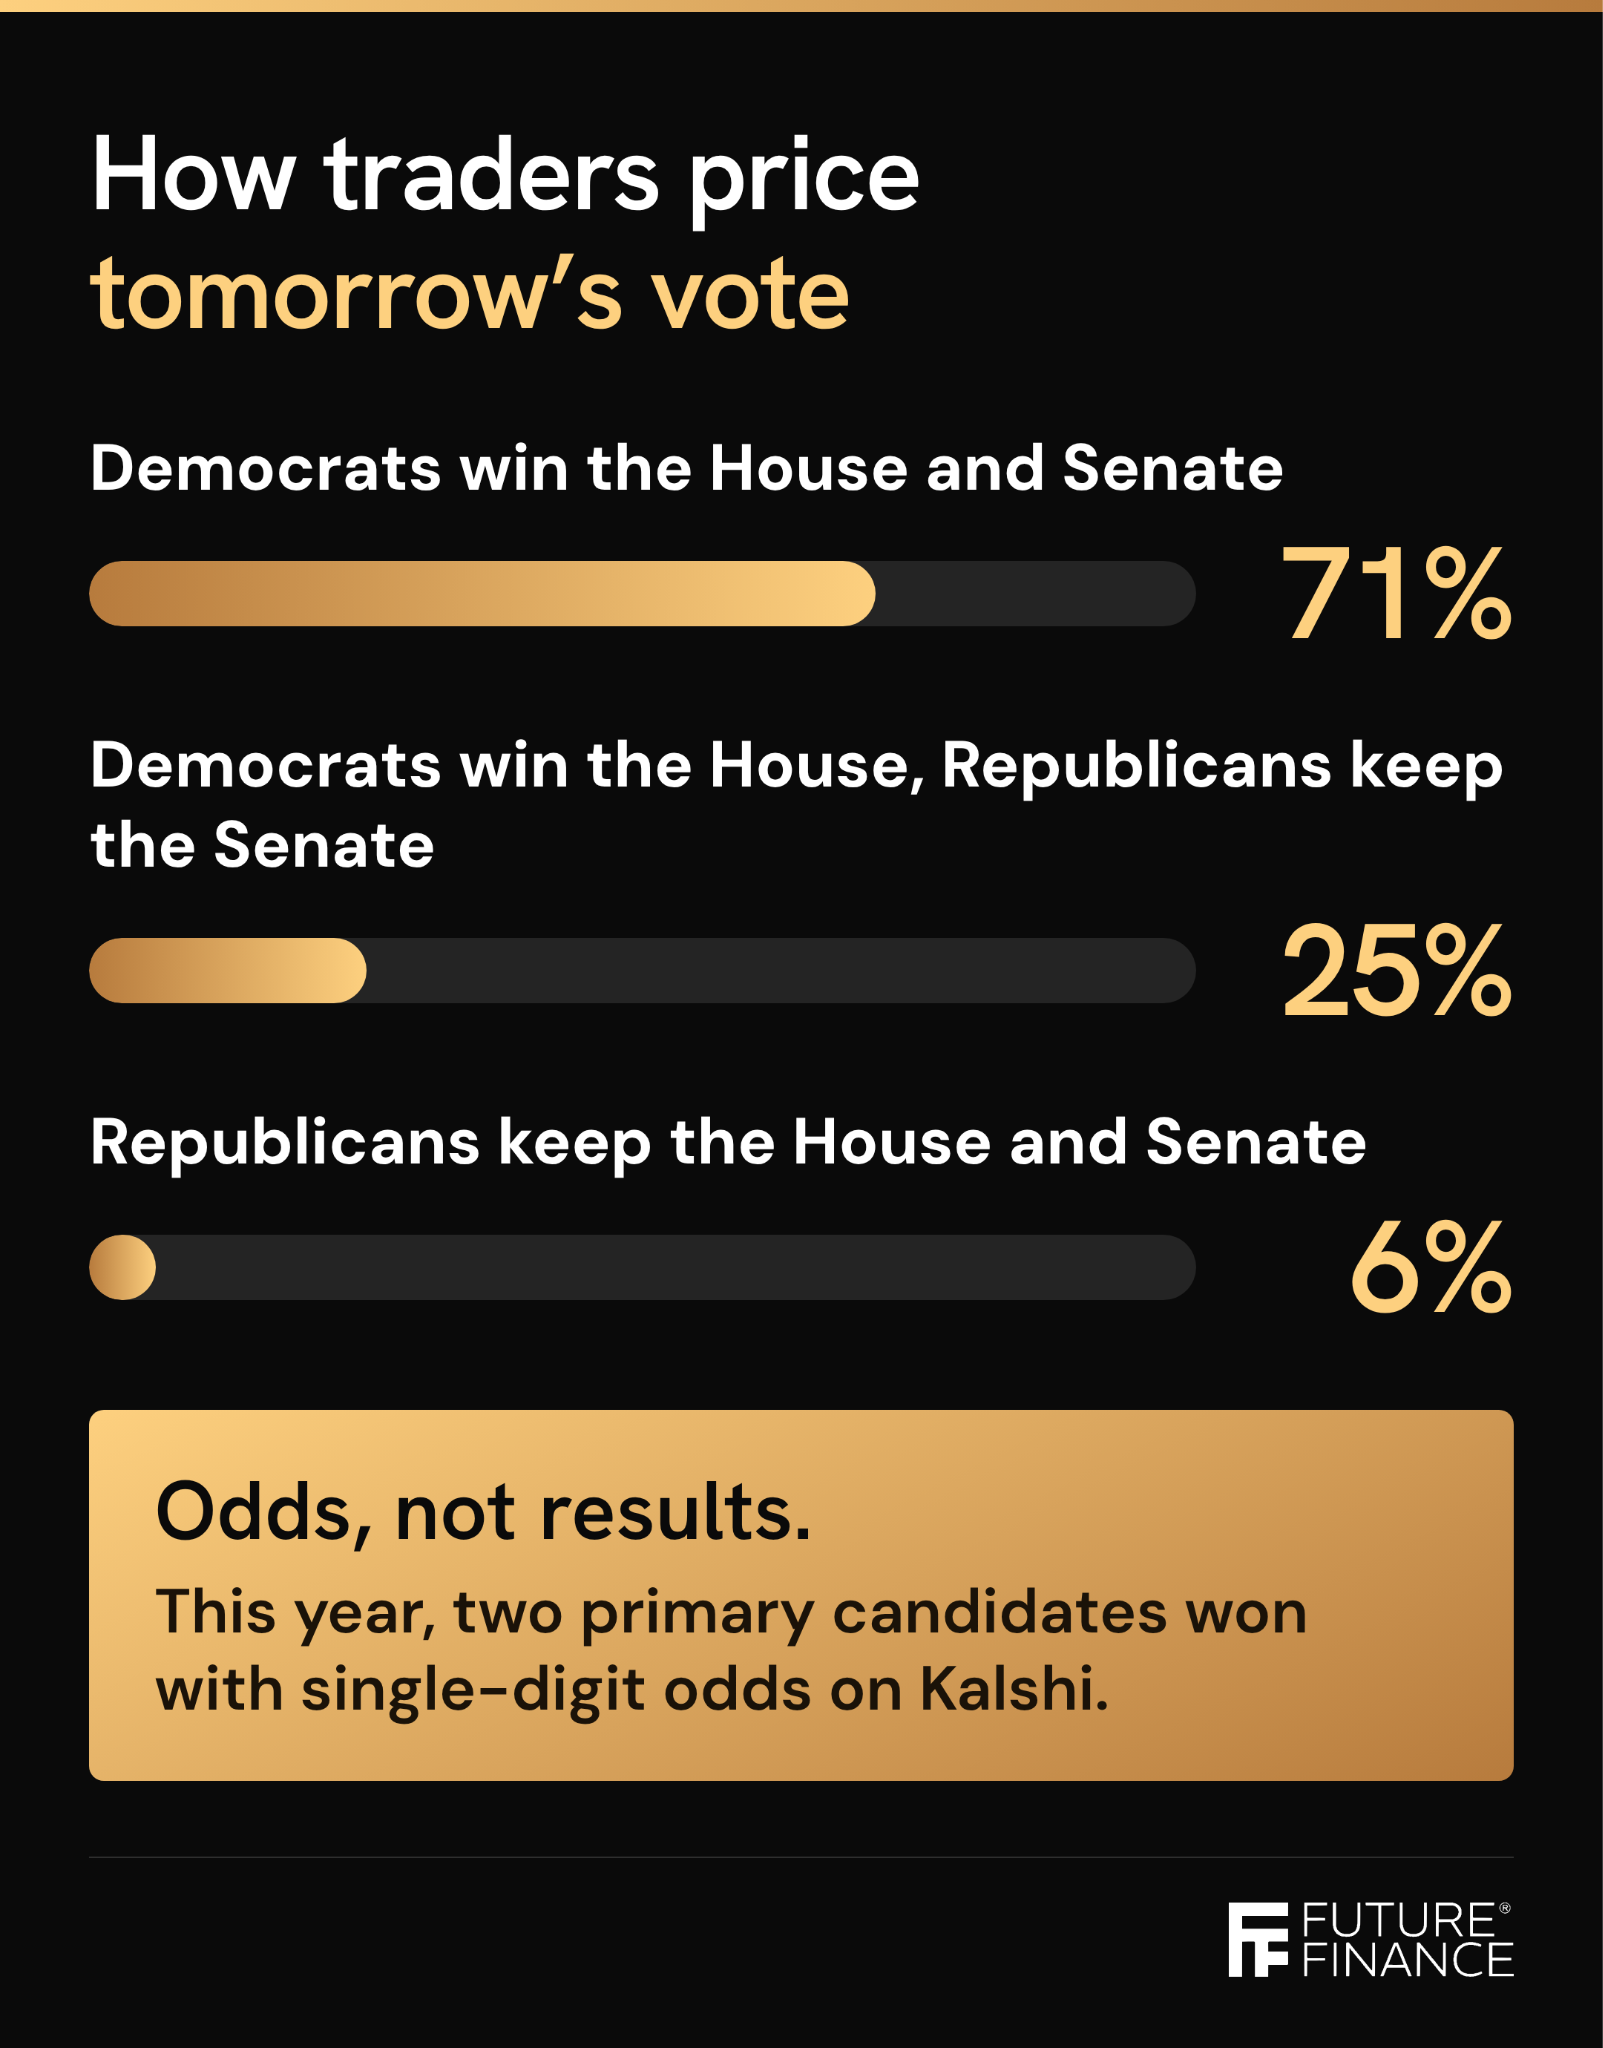
Those are odds, not results. Here’s what history says about each one.
If one party controls the White House and Congress
That’s the outcome if Republicans keep both chambers.
Over long stretches, unified government has done about as well as divided government. Dow Jones Market Data puts them at 7.45% and 7.26% a year since 1928.
Zoom in on one party and the studies scatter. Depending on the source and the years, unified Republican control has averaged anywhere from about −1% to 14.5% a year. The samples are too small to say much.
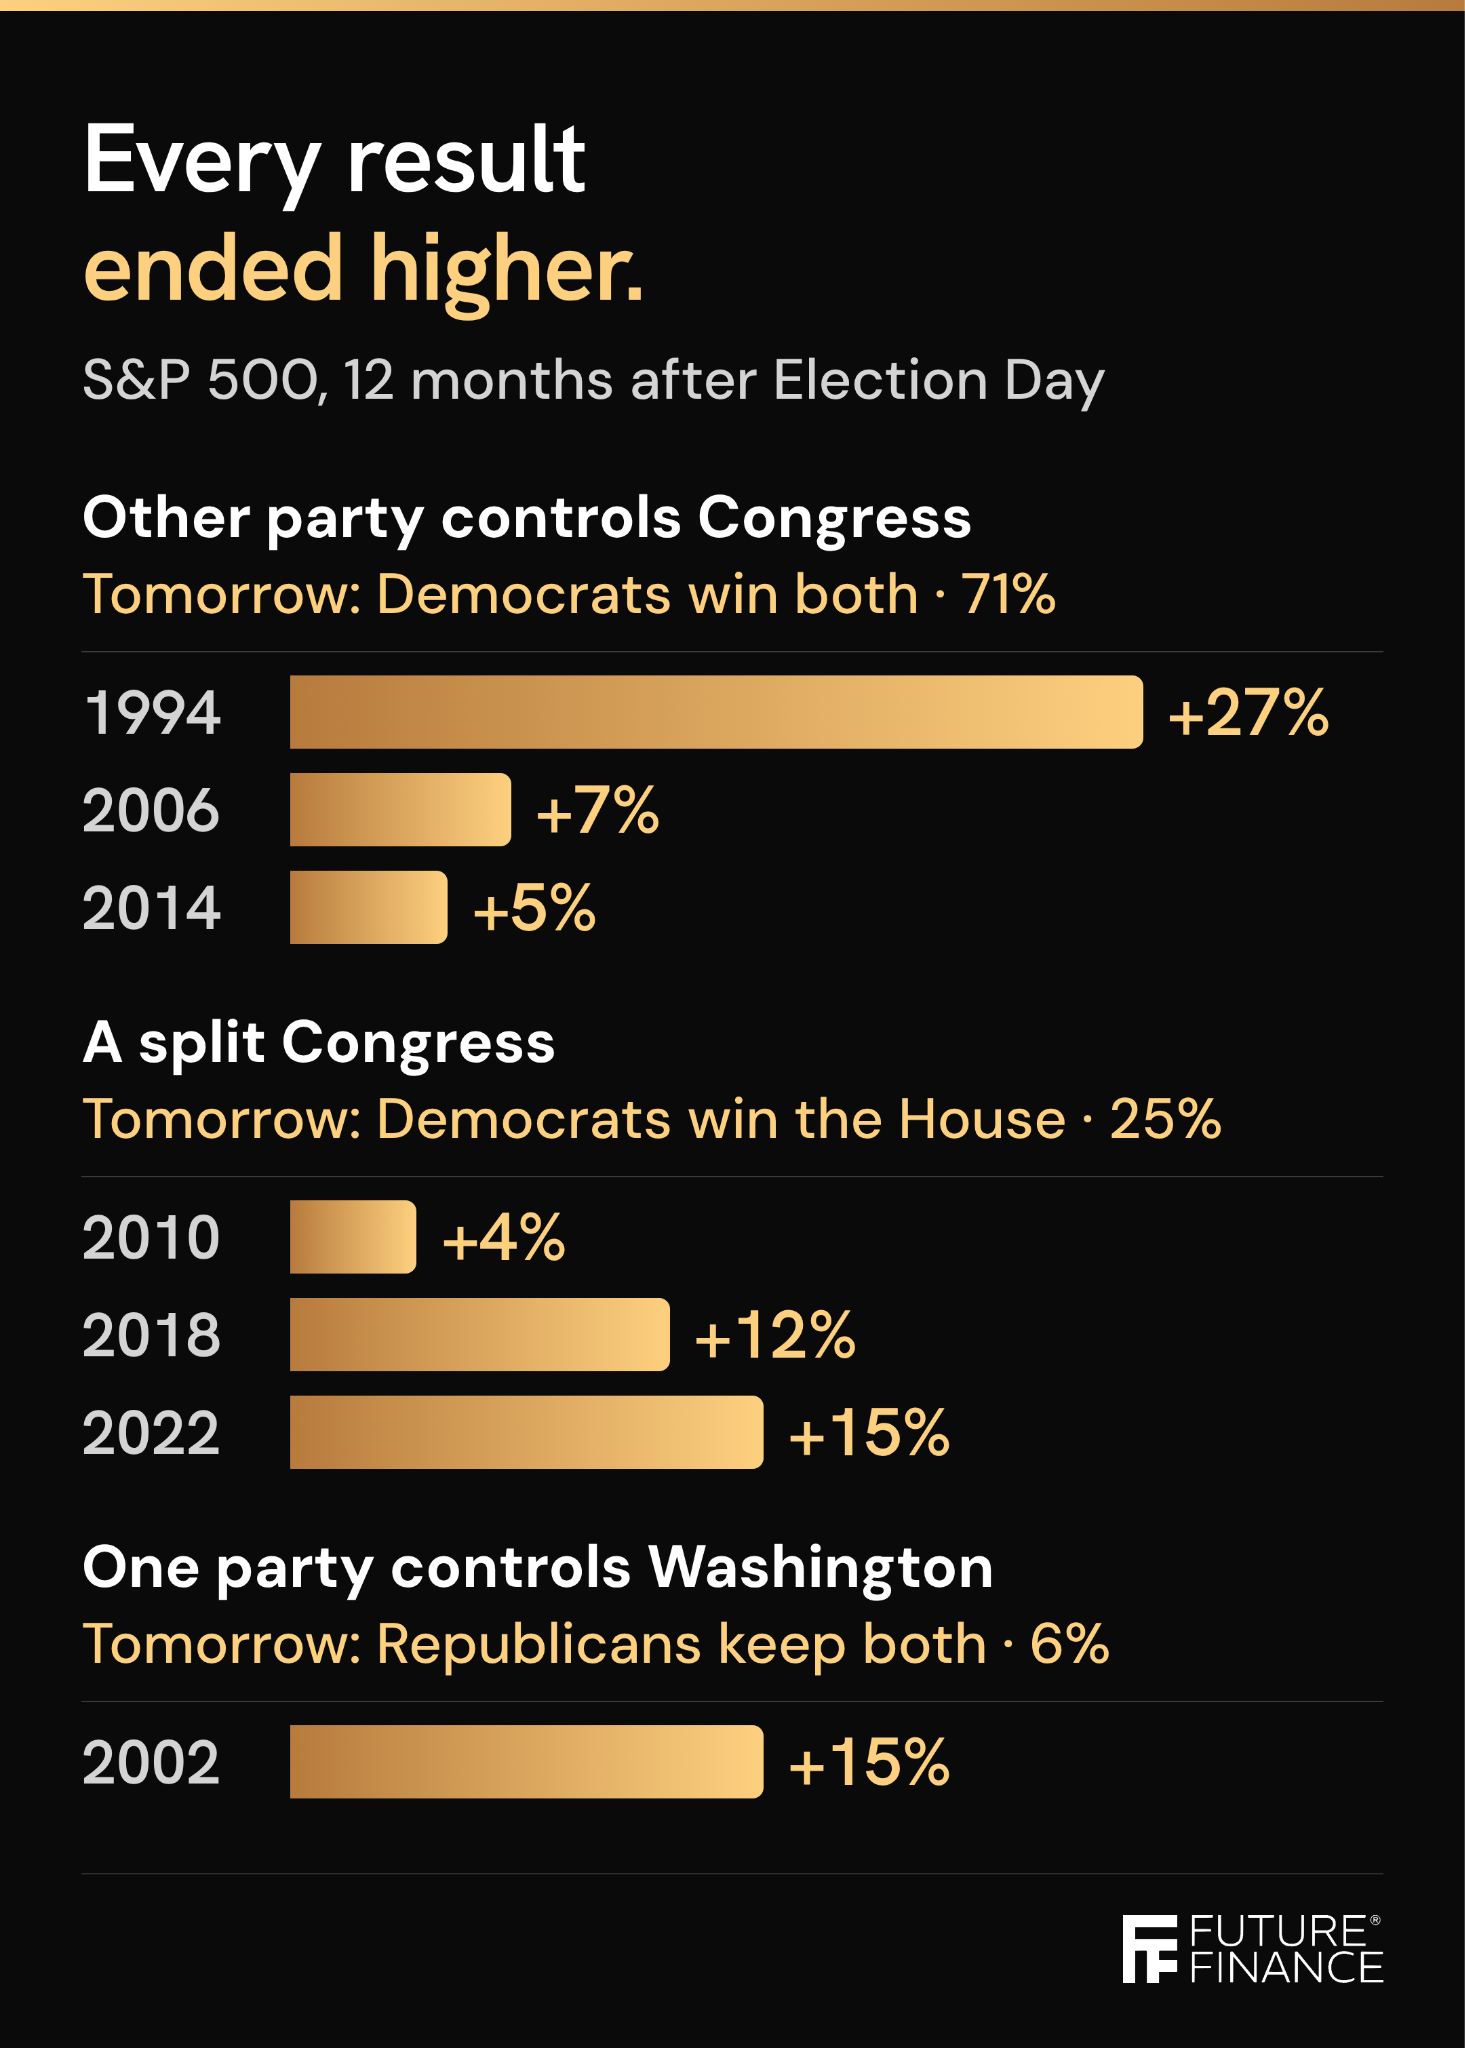
The most recent example came in 2002, when Republicans held the House and took back the Senate. Twelve months after Election Day, the S&P 500 was up about 15%.
If Congress is split
That’s the outcome if Democrats win the House and Republicans keep the Senate.
This is where the bullish charts come from. LPL Financial found a split Congress averaged 17.2% a year from 1950 to 2019, and Carson Group counts 14 straight positive split-Congress years through 2024.
The last three midterms that produced one, measured 12 months after Election Day:
- 2010: Democratic president. Stocks up about 4%.
- 2018: Republican president. Up about 12%.
- 2022: Democratic president. Up about 15%.
Higher every time, with a wide range in how much.
If the other party controls both chambers
That’s the outcome if Democrats win both the House and the Senate, facing a Republican president.
It’s the arrangement behind that 4.9% figure. But look at three recent midterms that produced it:
- 1994: Republicans won both chambers under a Democratic president. Stocks rose about 27% over the next 12 months.
- 2006: Democrats won both chambers under a Republican president. Up about 7%, before the 2008 financial crisis hit.
- 2014: Republicans won the Senate and kept the House under a Democratic president. Up about 5%.
Same arrangement, with results anywhere from 5% to 27%.
The finding: history doesn’t pick a winner
Put the studies side by side, and no arrangement reliably beats the others. The rankings flip with the start year, the time window and a handful of recession years.
Morningstar’s Dan Lefkovitz summed it up: “Markets have actually performed better overall under unified government than divided, but they’ve performed well in both.”
Whatever the result tomorrow, history doesn’t say stocks are doomed or guaranteed for the next two years.
The pattern that has held
One thing has been far more consistent than any party arrangement: the calendar.
Midterm years are usually rough. Since 1942, the S&P 500 has averaged an 18% peak-to-trough drop in midterm years, according to the Financial Times. This year’s deepest drop was about 9%, from late January to March 30.
After the vote, the record is strong. Since 1950, the S&P 500 has been higher 12 months after every midterm election, 19 out of 19, with an average gain of about 15%, according to J.P. Morgan Asset Management.
The usual explanation has little to do with who wins. Before an election, investors don’t know the result. After it, they do. As J.P. Morgan puts it, “markets don’t like uncertainty, and elections breed uncertainty.”
Nineteen is still a small number, and past results guarantee nothing.
What tends to matter more
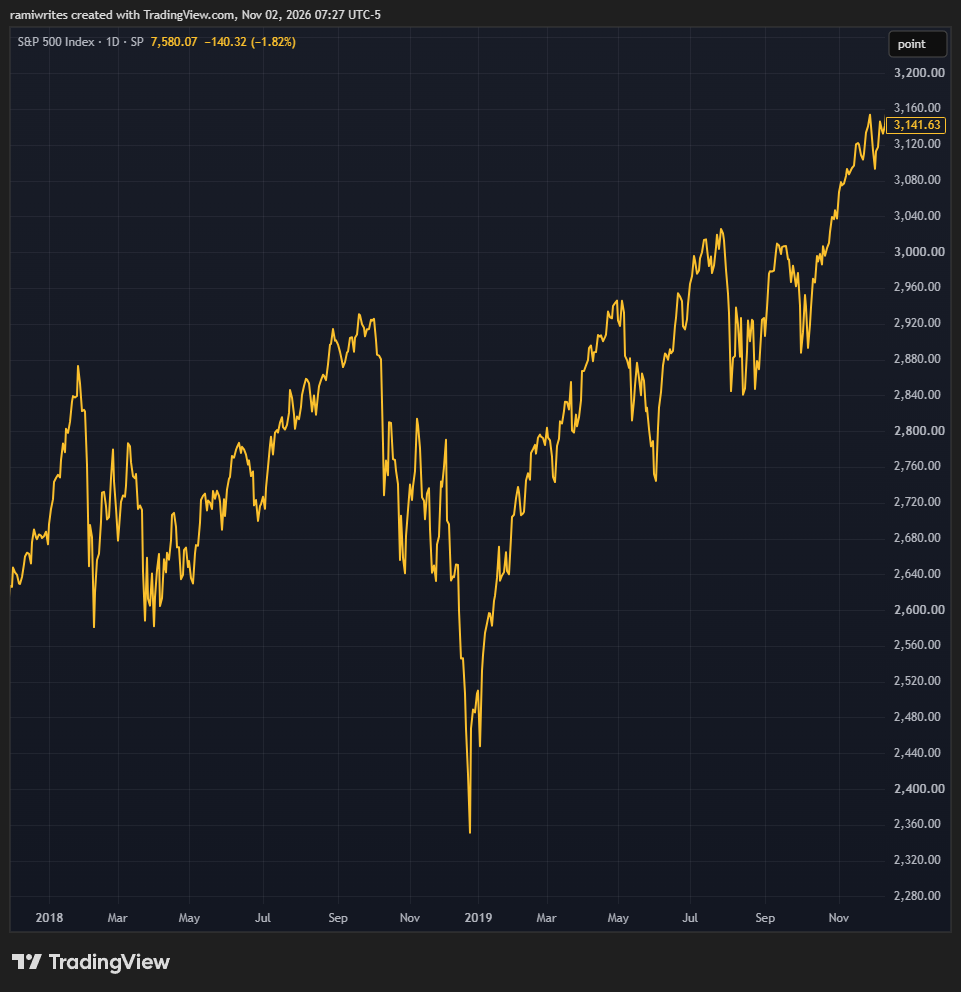
Take 2018. The midterm produced a split Congress, and by Christmas Eve the S&P 500 sat almost 20% below its September high as the Fed kept raising rates. Twelve months after the vote, it was up about 12% anyway.
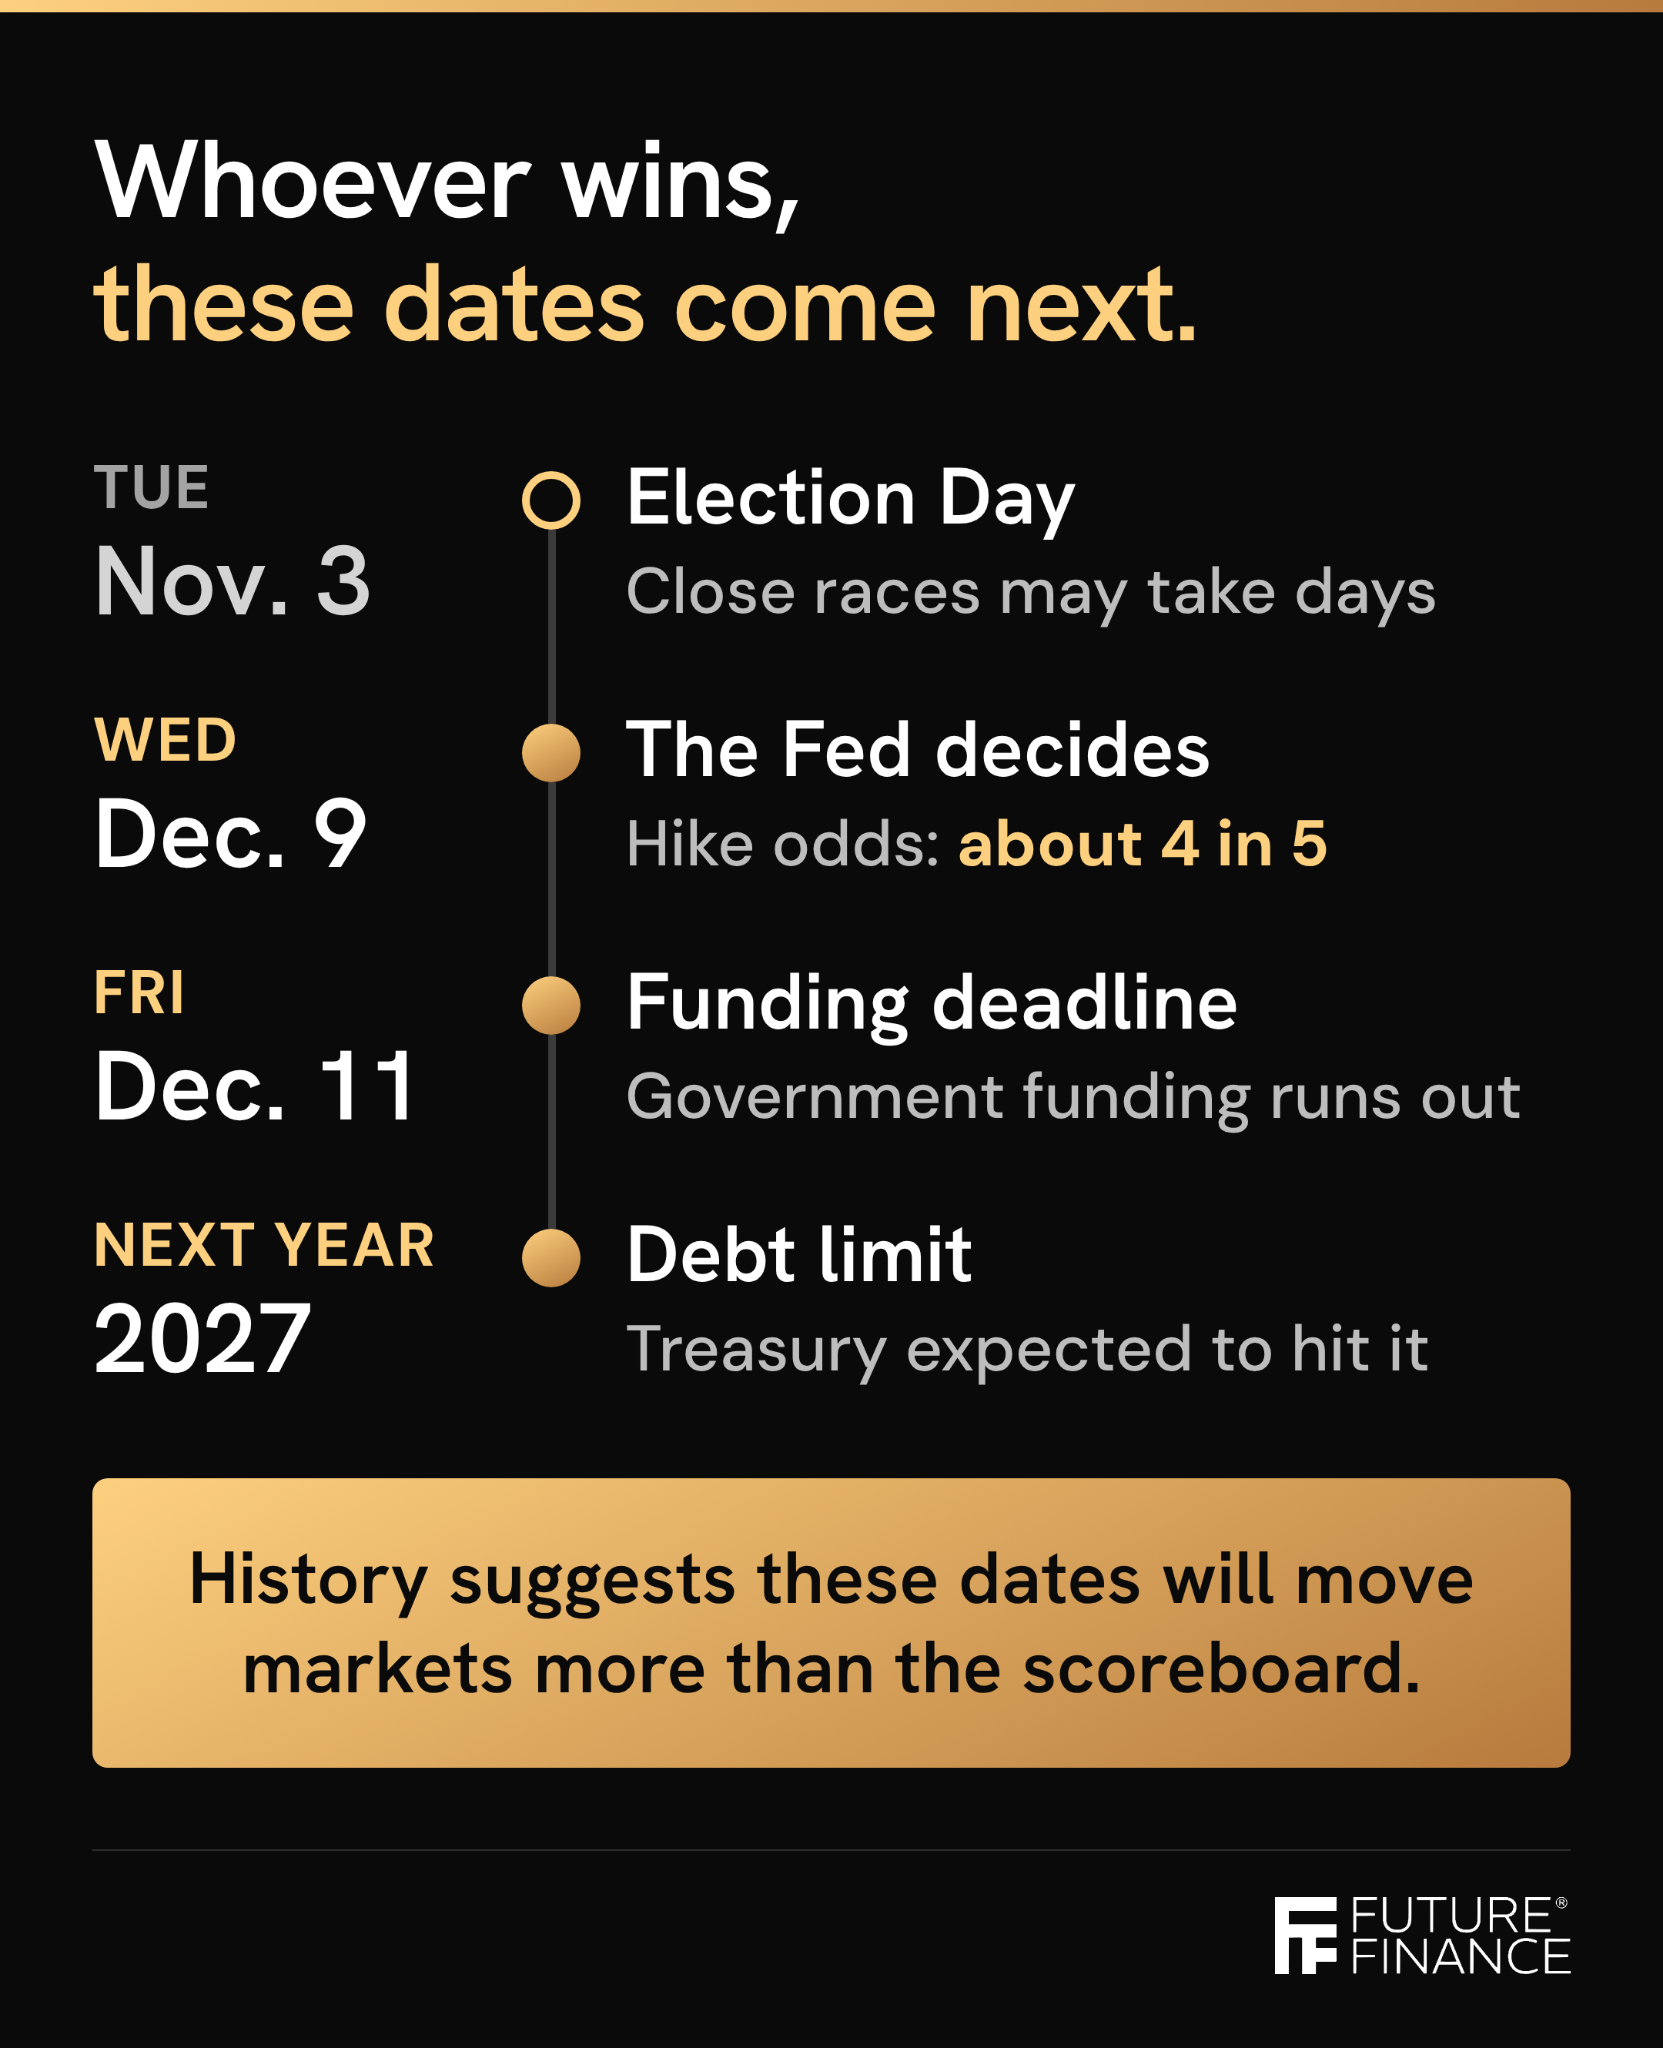
This year, the Fed decides Dec. 9 with a hike priced at roughly 4 in 5. And whoever wins, Washington faces two deadlines: government funding runs out Dec. 11, and Treasury is expected to hit the debt limit sometime in 2027.
History suggests those dates, along with earnings and oil, will move markets more than the scoreboard.
Whoever wins tomorrow, the party scoreboard has been a poor guide for stocks. The calendar has been a far better one.
Tomorrow, I’ll walk through what the odds mean, and what Polymarket is.
The Vote Is Tomorrow. The Deadlines Come After.

Whatever happens Tuesday, the next few weeks bring dates that move money:
- Treasury’s borrowing plans on Wednesday.
- The Fed’s decision on Dec. 9.
- A government funding deadline on Dec. 11.
- A debt limit expected sometime in 2027.
The Macro Letter is where Tan Gera, Decentralized Masters’ co-founder and a CFA charterholder, tracks dates like these twice a week, and explains what each one means for rates, stocks, gold and digital assets.
Here’s what you get:
- His own levels, in advance: the prices where he’d add to or trim his own portfolio, written down before the market gets there
- His calls, graded: past calls checked in the open, misses included
- Plain English: one story per issue, with every term explained the first time it comes up
You don’t need to pick a side in the election to have a plan for what comes after it.
Positions described are Tan’s own portfolio, shared for transparency, and are not a recommendation to buy or sell any asset. Past performance is not indicative of future results.
Final Thought
This is a busy week, and the election is only one part of it.
Tonight, Australia’s central bank is expected to raise rates again.
Tomorrow, America votes, and close races may take days to call.
Wednesday, Treasury sets out its borrowing plans, and we’ll cover what the results mean for the CLARITY Act.
Thursday, the Bank of England decides, with a hike priced at about 94%.
Friday brings the October jobs report.
We’ll take them one day at a time. If you already have a plan, this week is a good one to leave it alone.
See you tomorrow.
Editor in Chief | Future Finance
P.S. What’s Happening in France Is a Warning for Your Money
More than half a million people marched across France over the cost of living, while the country’s 10-year borrowing costs hit a 24-year high.
The video explains how heavy debt and rising borrowing costs feed on each other, and gives five warning signs to watch in any heavily indebted country. Salim Elhila, Decentralized Masters’ co-founder, also lays out three paths countries in that position have taken: slow decline, sudden collapse and renewal.
With Washington facing its own funding and debt-limit deadlines after Tuesday’s vote, it’s a timely watch.

Five Gems Picks, Up 38% to 166% Since Coverage

Gems Uncovered is the weekly research newsletter from Decentralized Masters. Every week, our research team picks the digital assets it thinks the market is underpricing and sends subscribers the full case for each one.
Subscribers get that research on the day coverage starts, while the price is still where Gems found it. A few picks since Gems covered them:
- Magma Finance (MAGMA): up 166% since March 27
- Derive (DRV): up 147% since July 17
- Pump.fun (PUMP): up 72% since Aug. 7
- Venice (VVV): up 55% since Aug. 21
- NEAR Protocol (NEAR): up 38% since Sept. 18
Every subscription includes new picks each week, market commentary, updates on past picks and monthly performance reports that show every pick, winners and losers.
Not every pick works out, and the reports show those too.
See what Gems is covering now →
Returns run from each asset’s price on the day Gems Uncovered covered it to CoinGecko prices on Oct. 30, 2026, before fees and taxes. These are selected results: of the 86 assets Gems covered from January through September 2026, 17 were above their coverage price on Oct. 30. Past performance doesn’t guarantee future results. Nothing here is a recommendation.
Disclaimer: This content is not financial advice, it is for informational purposes only. All investments involve inherent risk. Any financial decisions you make are solely your responsibility.
Latest




Editor's Picks


Become a sharper capital allocator in 5 minutes a day.
Institutional-grade research on where the smartest capital is positioning, across AI, energy, biotech, robotics, and digital assets. Distilled into a daily read you finish before your coffee does.
Join 45,000+ readers · No spam · Unsubscribe anytime · No card needed