

$10,000 gold?
Gold fell into a bear market. Jim Rickards explains why, and where it heads next. →
July 27, 2026
·
10 min read



The briefing serious investors read first.
Free analysis before markets open. Start thinking in decades, not days.
Join 45,000+ readers · No spam · Unsubscribe anytime · No card needed
Today’s Big Picture
Gold has been one of the biggest stories of the decade. It ran to a record $5,355 an ounce in January, then fell hard enough to scare a lot of people out.
So the question on every gold investor's mind right now is simple. Is the bull market over, or is this just a dip?
Today I'm handing that question to someone worth listening to on it.
James Rickards is an economist and author who's advised the U.S. intelligence community, and gold is the subject he's studied longest.
Two things to hold before he starts.
- First, big bull markets almost never go straight up. The legendary ones tend to take a gut-check drop of around 50% somewhere in the middle, then keep climbing.
- Second, gold didn't fall because it lost its shine. It fell because of the dollar, and Jim will show you exactly how that works.
Today, I'm going to let him walk you through where gold has been, why it dropped, and the number he thinks it's heading toward next.
Here's James.
Featured Contributor
About The Contributor

Today, a special guest: James Rickards, economist, former advisor to the U.S. intelligence community, and author of Currency Wars and The New Great Depression, on whether gold's sharp pullback is the end of the bull market or the middle of it. You can see his full bio here…
Whither Gold?
That's the question gold investors are asking. The facts speak for themselves. The analysis is more difficult.
The dollar price of gold hit an all-time high of $5,355 per ounce on January 29, 2026. (That was a closing price for the gold futures contract on NYMEX. Some intraday prices and other sources show a slightly higher top.)
There has now been a sharp decline since then in the price.
In fact, the decline is the definition of a bear market by any measure.
The question investors are asking is whether this bear market will get worse. Was $5,355 the top of the bull market, to be followed by months or even years of a slow grind lower?
To answer that question, we have to answer a few others.

What History Teaches Us
The first great bull market lasted from 1971 to 1980, during which gold rose from $35.00 per ounce to $800 per ounce, a 2,200% gain.
This was followed by a bear market from 1980 to 1999, when gold fell from $800 to $250 per ounce, a 69% decline.
Another bull market followed from 1999 to 2011, during which gold rallied from $250 to $1,900 per ounce, a 670% gain.
Then came a second bear market, with gold falling from $1,900 to $1,050 per ounce by December 2015, a 45% decline from peak to trough.
We are currently in a third great bull market of the post-1971 period, with gold having risen from $1,050 to $5,355 per ounce, a 410% gain over the course of the past twelve years.
It's clearly the case that gold is volatile and can produce long bear markets alongside spectacular rallies. But the long-term case is impressive. If we take the entire period from 1971 to 2026, gold increased from $35.00 per ounce to $5,355 per ounce (before the current dip) for a cumulative gain of 15,200%. On a risk-adjusted basis, that's a fabulous return considering that gold doesn't go bankrupt or default on payments like companies that issue stocks and bonds.
The 50% Rule
The next part of the analysis relates to something Jim Rogers told me in 2012, when gold was still struggling through the second bear market.

Rogers is one of the greatest commodity traders of all time and was the co-founder of the Quantum Fund with his partner George Soros.
He told me that no commodity "goes to the moon" without a 50% drawdown along the way.
Investors not prepared for that kind of volatility and that kind of drawdown should not be in the market.
His words were prophetic.
Using the 1999 price of $250 per ounce as a baseline and the 2011 peak of $1,900 per ounce, gold had gained $1,650 per ounce in the prior bull market.
Applying Rogers' 50% rule, a drawdown of $825 per ounce would satisfy the condition.
Subtracting $825 from $1,900 produces a target bottom of $1,075 per ounce. On December 15, 2015, a few years after we spoke, gold hit a bottom of $1,050 per ounce, which was within 2.3% of Rogers' target and precisely met his 50% drawdown forecast.
Gold started its next great rally from that exact level and has been rising ever since.
In complexity theory and fractal mathematics, there's a concept called scale invariance. It means that price patterns repeat in identical ways, but at different scales and over different timeframes. In plain English, this means that a one-week stock chart can appear almost identical to a ten-year stock chart adjusted for time and index level.
Let's apply Rogers' 50% drawdown rule using the fractal method.
We can reasonably date the start of the current bull market from October 1, 2023, at a price of $1,845 per ounce. (Gold prices moved relatively little from 2019 to 2023.) The market peaked at $5,355 in January 2026. The dollar gain in that period was $3,510 per ounce. A 50% drawdown of that amount is $1,755 per ounce. Subtracting that amount from $5,355 would produce a price of $3,600 per ounce to meet the 50% drawdown that the Rogers method would predict using fractal mathematics.
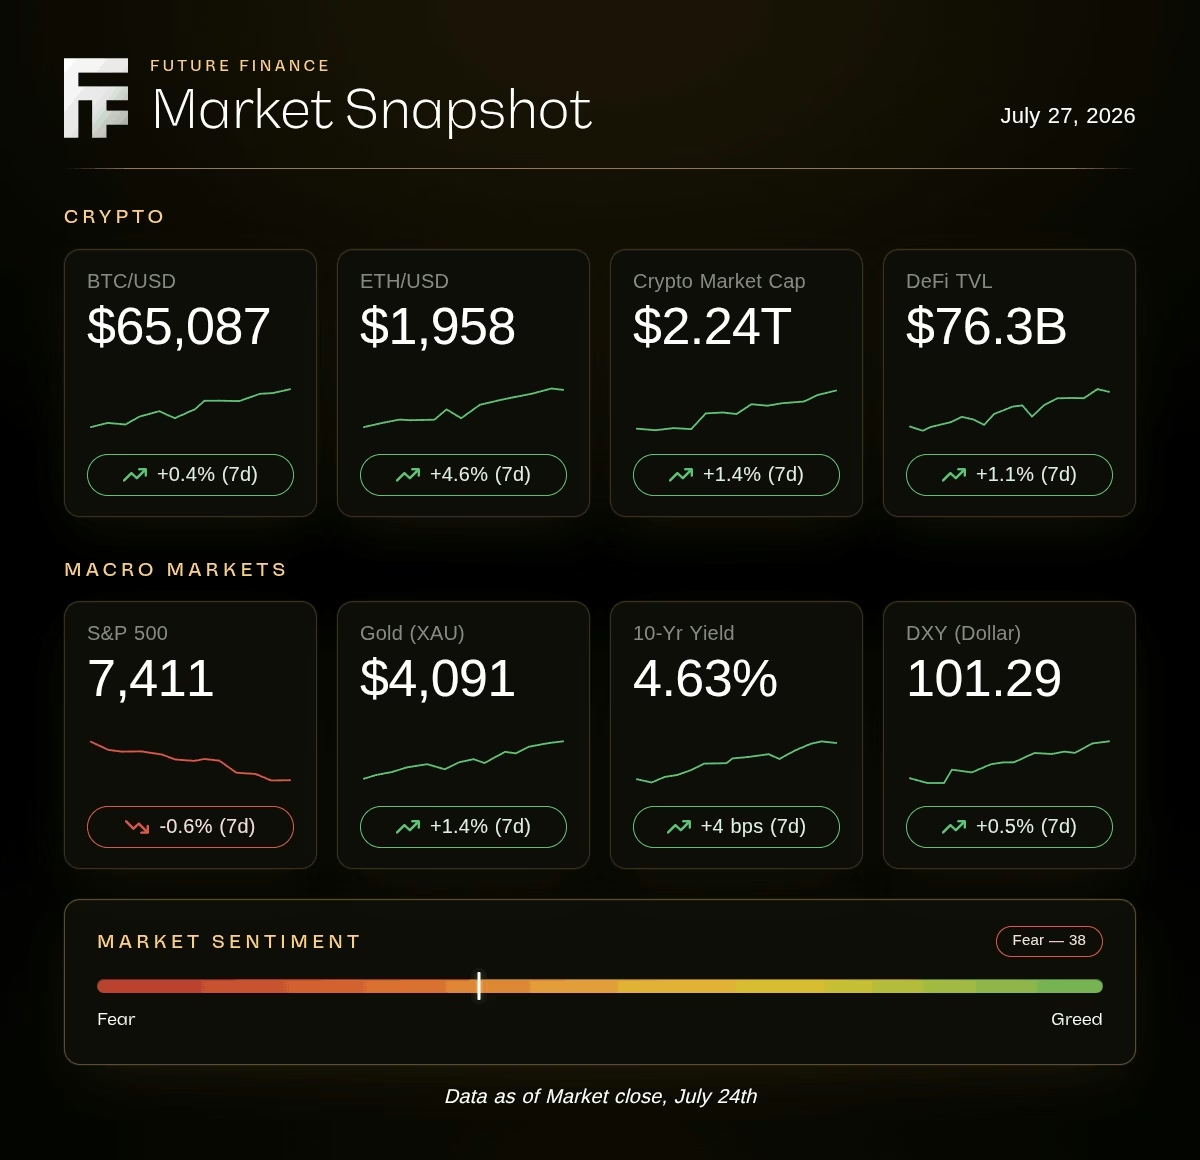
We haven't got to that level yet (at $4,100 at this writing) but the dollar drop and the percentage drawdown are of the same order of magnitude as a Rogers-style commodity correction that presages a renewed bull market.
Why Gold Really Fell
The cause of gold's drawdown is straightforward.
The spike in oil prices from the $60-per-barrel range before the war in Iran to $115 per barrel in early April (and much higher in spot physical markets) caused a mad scramble to buy oil, which in turn caused a mad scramble for U.S. dollars since oil is priced in dollars.
Reports of the death of the petrodollar standard were premature.
The petrodollar system is as strong as ever and those predicting the end of the dollar as the leading reserve currency have been proved wrong once again.

When countries are desperate for dollars, they sell gold for dollars.
That drives the dollar price of gold lower.
There are force multipliers, including traders hitting stop-loss limits, leading to more selling, more stop losses and a downward spiral. Momentum traders then join the fun and pile on with even more selling.
All of these forces — higher dollar oil prices, forced selling of gold and momentum trading — eventually run out of steam. Oil prices are down in anticipation of an end to the Iran war. The shorts have mostly closed out their trades.
The momentum players are cashing in their chips. The weak hands have sold and moved on.
Where It Goes From Here
The gold price may meander down to the $3,600-per-ounce level, a pure fractal result, or it may have found a bottom at $4,110, once again illustrating the volatile nature of commodity trading in general and gold in particular.
If you own gold, hang on.
If you're looking to buy gold, this is an excellent entry point.
Both groups of investors could enjoy substantial gains in the months and years ahead as a new bull market finds its legs, moves decisively past $5,000 per ounce and ultimately heads toward $10,000 per ounce — and potentially higher.
That was James Rickards.
If his read on gold has you wanting the specifics, here's the part worth knowing. Jim's put one of his favorite gold plays on the table, a single ticker, completely free. It's built around a catalyst he's circled for September 30, and you can see the whole case at no cost.
See Rickards' free gold play here…

The $1 TRILLION Gold Shock Rickards Says Is Coming Sept. 30
Gold ran to a record earlier this year, then pulled back hard. Jim Rickards, who many call America's #1 gold expert, says the bigger move is still in front of us.
He points to September 30, 2026 as the date a major shock hits the gold market, tied to what he describes as a Trump-administration gold initiative he believes could unlock up to $1 trillion in gold over the coming year.
He's just released one of his favorite gold plays, a single ticker, 100% free.
See Rickards' free gold play here →
Paradigm Press is a paid partner of Future Finance. The forecasts and claims above are James Rickards' and Paradigm's, not Future Finance research or advice. As always, do your own diligence.
Signal vs. Noise
Three Headlines, Three Realities

- The first headline is that gold falling into a bear market means the gold story is broken.
- What reality says: the biggest bull markets always take a scare like this along the way.
A drop this size feels like the end. History says it's often the middle.
By the rule Jim laid out, the great runs tend to suffer a drawdown of around 50% and then keep climbing. Gold did exactly that in 2015 before its next surge.
A pullback and a top look identical in the moment. They're rarely the same thing.
The scary part of the chart is usually the part you get paid for later.

- The second headline is that gold dropped because investors lost faith in it.
- What reality says: it dropped because the world scrambled for dollars, not away from gold.
When oil spiked on the Iran war, and oil is priced in dollars, countries had to chase dollars fast. Many sold gold to get them.
That's a dollar story, not a gold story. The selling was mechanical, and the forces behind it, Jim argues, are already burning out.
Nothing about gold's long-term case changed. The plumbing just got noisy for a while.
Follow the dollar, and the gold move stops looking mysterious.
- The third headline is that a strong dollar and a busy Fed make hard assets pointless.
- What reality says: a debt near $40 trillion is the whole reason to hold them.
The Fed meets this week with rates at 3.50% to 3.75%, and the dollar looks strong this quarter.
But step back. The national debt is near $39.5 trillion, and the long-term answer to debt that size has always been a slowly weaker currency. That's the exact risk gold is built to offset.
Strong today doesn't mean sound forever. That gap is why gold has a permanent seat in a serious portfolio.
Gold's job was never to win the quarter. It's to still be standing when the quarter goes wrong.
Today’s Final Thought
Gold's drop was loud enough to shake a lot of people loose.
Jim's piece is a useful reminder that loud and important aren't the same thing. Fifty years of gold cycles say the giant runs come with gut-check drops built in, and that the reason for this one sits with the dollar, not with gold.
You don't have to time the bottom to take the lesson. Gold isn't there to win any single quarter. It's there so that when the dollar eventually gives back some of its strength, and a debt near $40 trillion says it will, you're already holding the thing that's meant to catch it.
The weak hands sold the scary part of the chart.
The patient ones are still holding the story.
- Rami Al-Sabeq (Editor in Chief | Future Finance)
One Subscription. The Entire Gems Uncovered Research Library.

You just read why the surface of the news rarely tells the whole story.
Gems Uncovered is built on that same principle. It's our monthly research briefing on early-stage assets and native market access, the opportunities that build real wealth before they ever reach a mainstream exchange.
One level beneath the headlines is where the edge lives.
Subscribe to Gems Uncovered →
Disclaimer: This content is not financial advice, it is for informational purposes only. All investments involve inherent risk. Any financial decisions you make are solely your responsibility.
Latest



Editor's Picks

Become a sharper capital allocator in 5 minutes a day.
Institutional-grade research on where the smartest capital is positioning, across AI, energy, biotech, robotics, and digital assets. Distilled into a daily read you finish before your coffee does.
Join 45,000+ readers · No spam · Unsubscribe anytime · No card needed