

39 years ago today, the Dow lost 22.6%…
The ones who came out ahead didn’t see it coming. →
October 19, 2026
·
5 Min Read



The briefing serious investors read first.
Free analysis before markets open. Start thinking in decades, not days.
Join 45,000+ readers · No spam · Unsubscribe anytime · No card needed
Today’s Big Picture
39 years ago today, the Dow lost 22.6% in a single session. At today’s level, that would be about 11,750 points.
Black Monday is still the worst day in stock market history. The worst day of the COVID crash, by comparison, was a 12.9% drop.
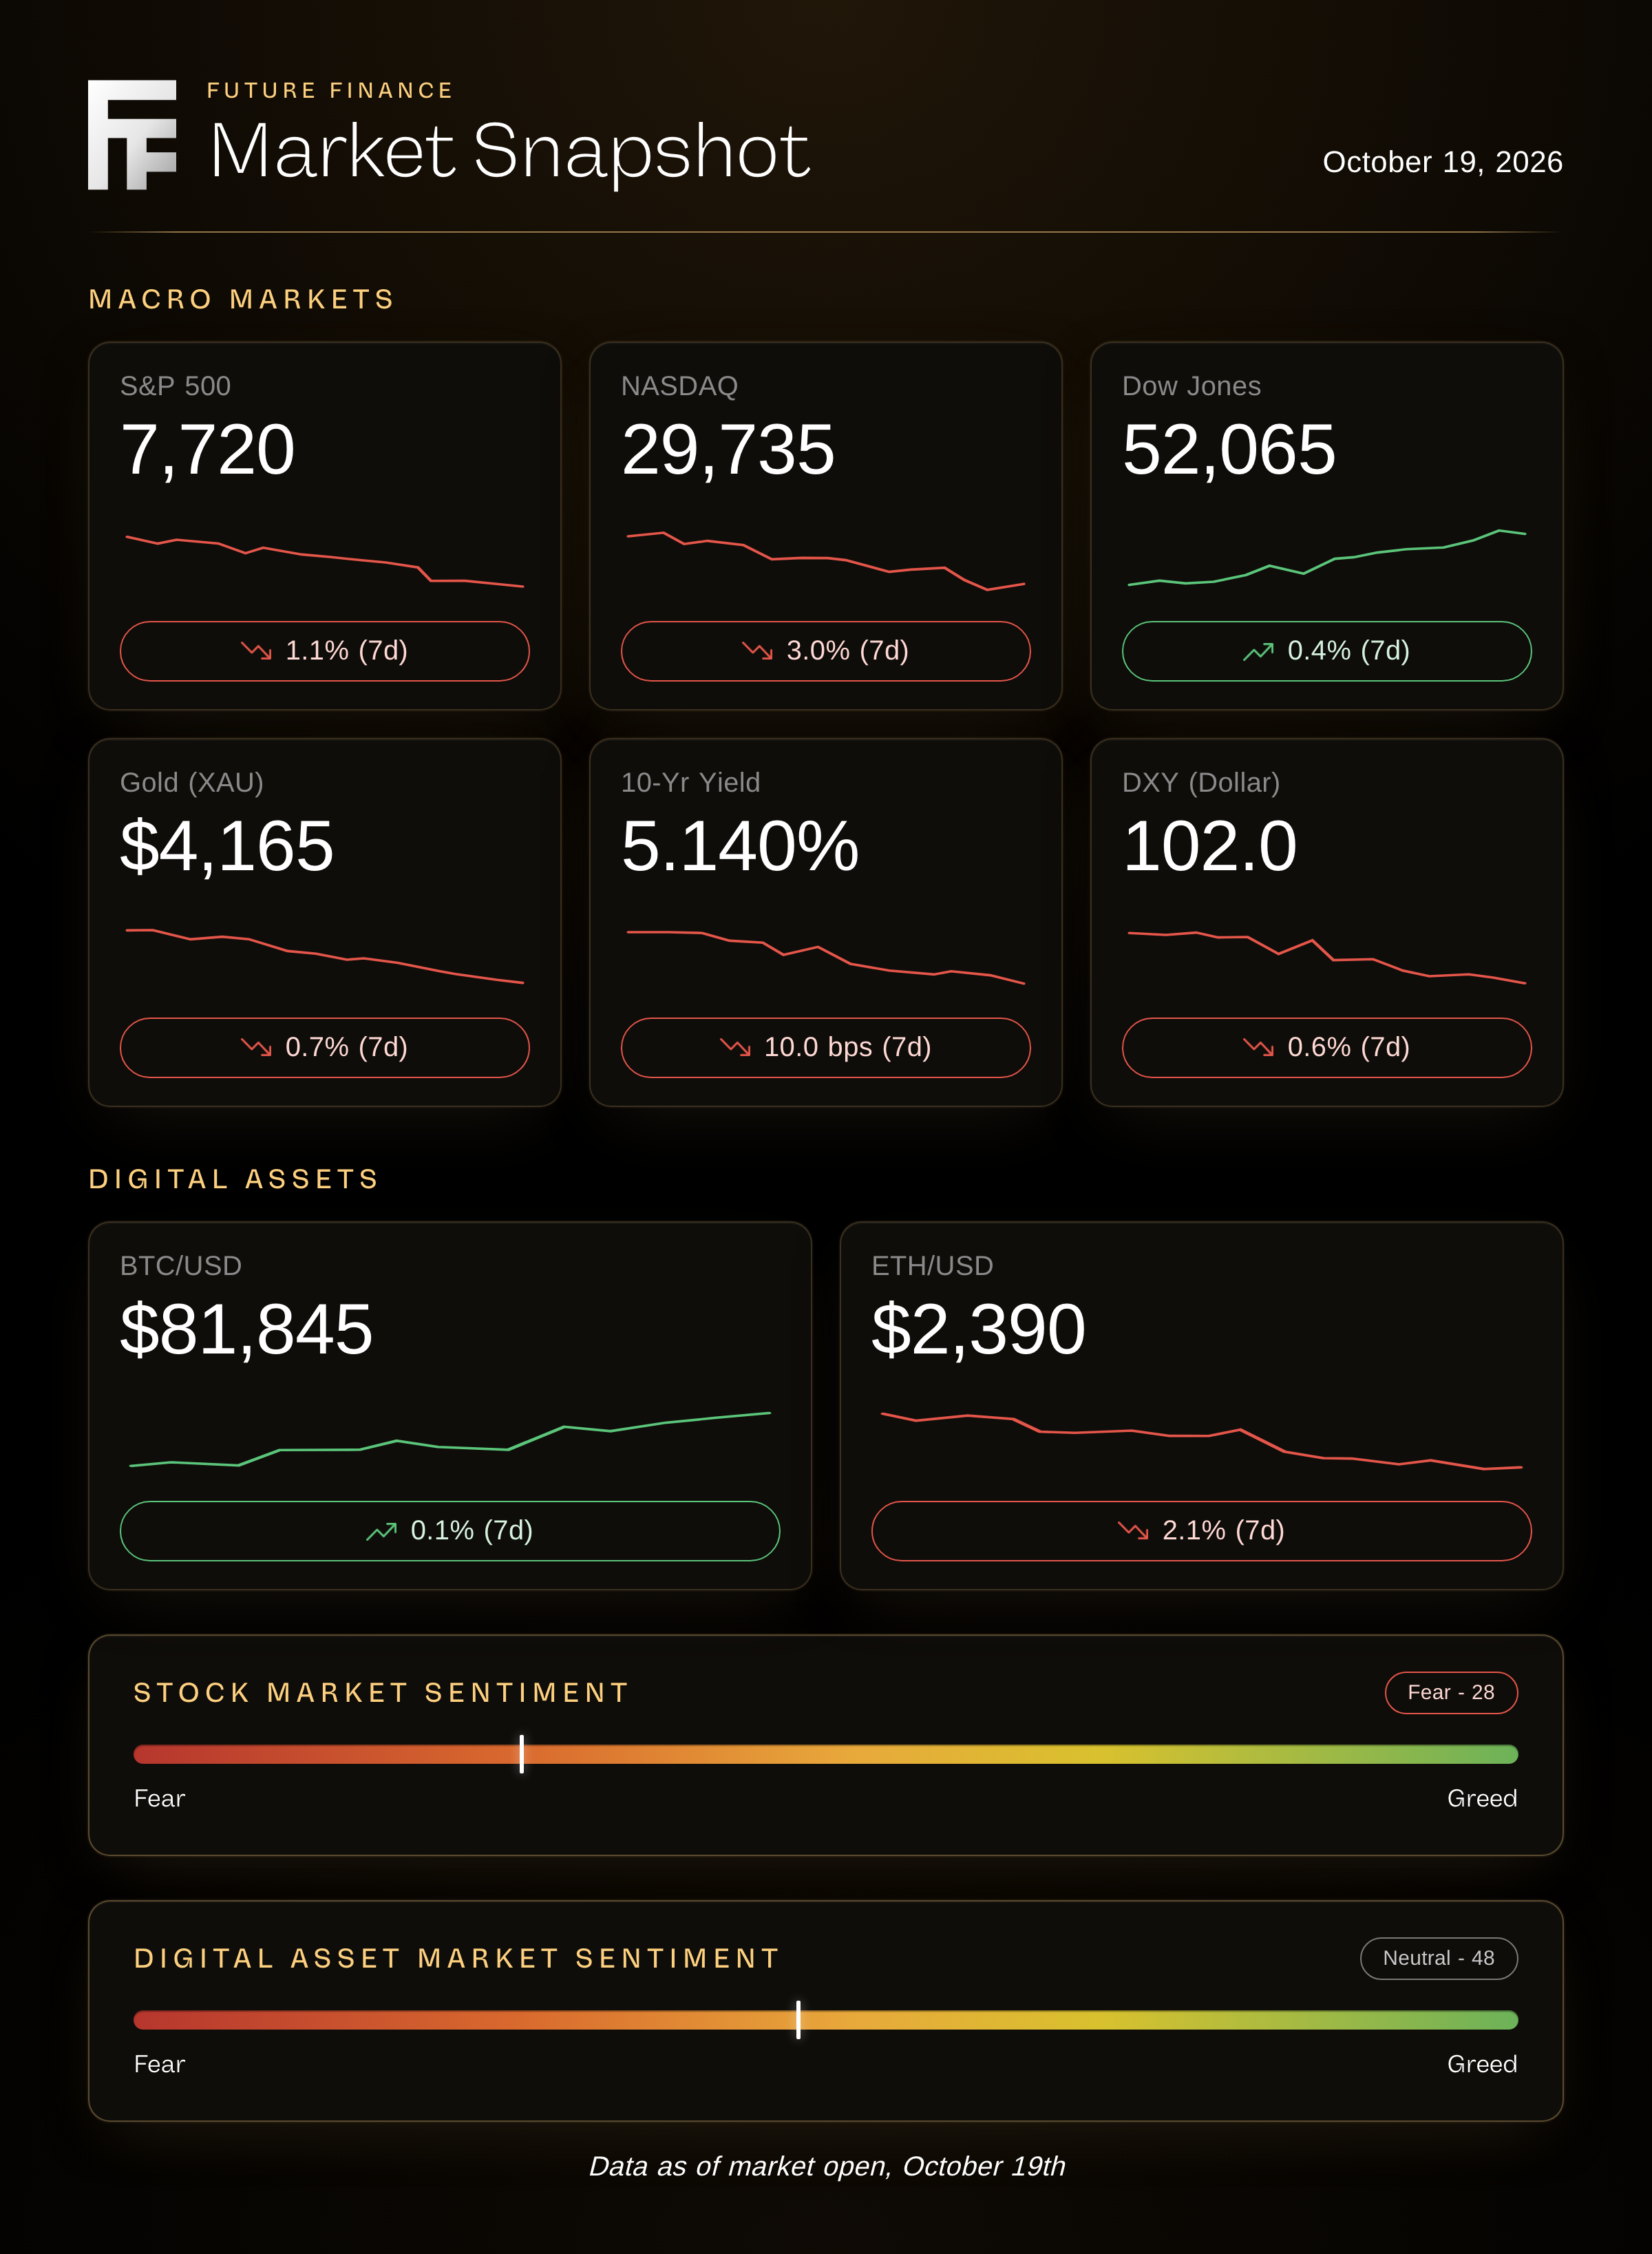
The anniversary lands on a nervous Monday. Last week the Nasdaq fell 4.5%, its worst week since June, and chip stocks fell eight days straight.
Friday also ended a 55-day run without a 1% drop in the S&P 500. By the weekend, “Black Monday” was trending online.
Some perspective before anyone reaches for the sell button. The S&P 500 is still up 11.9% this year. And bonds rallied last week, the reverse of 1987, when surging yields pulled money out of stocks.
The crash is what people remember. What they did next is what cost them.
Below, Tan Gera on who came out ahead in 1987. Very few of them saw it coming.
Paid Advertisement
One Portfolio Built for Every Kind of Market
Black Monday erased 22% in a single session. The people who came through it weren’t the ones who guessed right. They were the ones who already owned a mix built to hold up in any week.
That’s the whole idea behind the ABN system. In a free training, Tan Gera walks through how to build an all-weather portfolio designed to protect and grow across every market condition, up, down, or sideways, with no experience required.
Watch the free ABN training →
Disclosure: Decentralized Masters is a paid partner of Future Finance. The forecasts, track record and claims above are the views of Decentralized Masters, and do not represent the view of Future Finance. As always, do your own diligence. Educational content. Nothing in the training is a recommendation to buy or sell any asset, and all investing carries risk.
Signal vs. Noise
The AI Trade Just Had Its Worst Week Since June
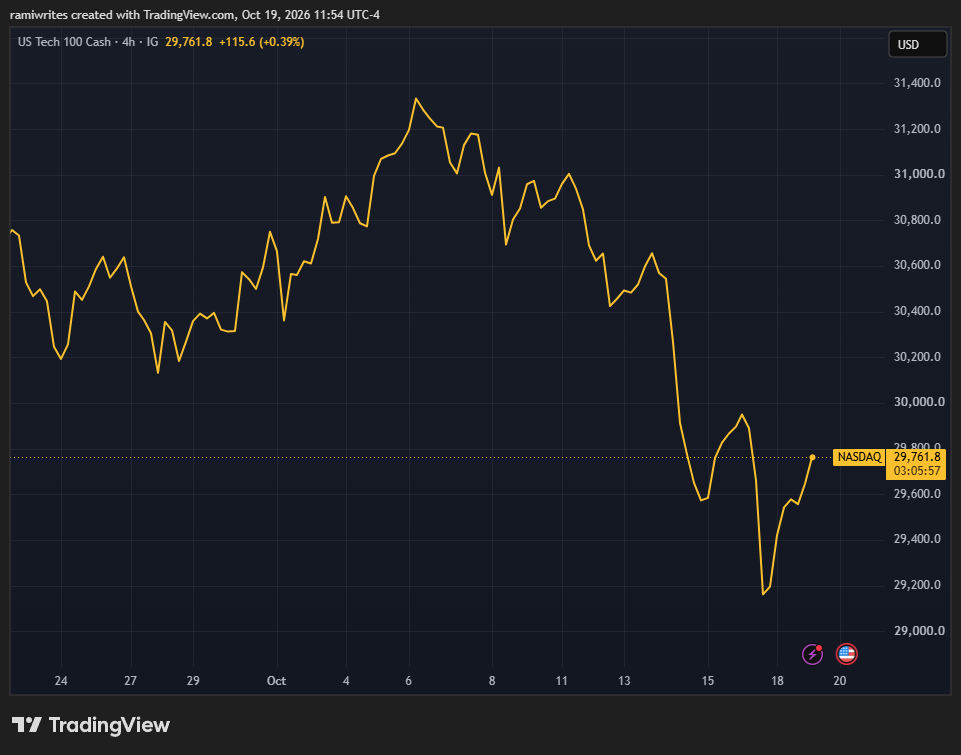
- The noise: the Nasdaq’s 4.5% drop, and talk of a “Black Monday 2.0.”
- The signal: where the selling hit. Chip stocks fell eight straight days, tying their longest losing streak since 2006. Micron and Intel each fell more than 5% on Friday alone.
CoreWeave, which rents out AI computing power, was on track for a weekly drop of more than 15% on worries about its roughly $50 billion in debt.
Dylan Jovine argued last Monday that the AI boom had turned into a credit bet. Last week, the market started pricing it that way.
Meanwhile, the equal-weighted S&P 500, where every company counts the same, had its best week against tech since 2009.
For beginners: Wednesday is the next test. Meta, Tesla, Lam Research and Texas Instruments all report after the close.
Hot Inflation, Cooler Fed Odds
- The noise: September’s inflation numbers ran hot. Consumer prices rose 3.7% from a year ago, and wholesale prices rose 6.3%.
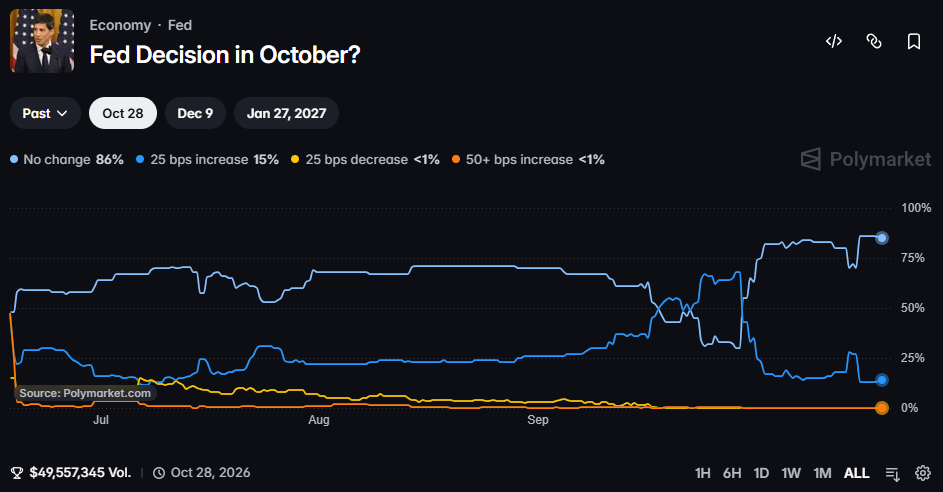
- The signal: traders stopped betting on an October hike anyway. The odds of a hike on Oct. 28 were 14.9% Monday morning, per CME FedWatch, down from above 40% last Wednesday.
They still expect one, just later. Bettors on Polymarket put the odds of a December hike at 79%.
The calendar helps explain it. The October decision lands six days before the midterms, and since 1990 the Fed has raised rates within a week of an election only once, in November 2022.
For beginners: Treasurys had their best week since February, pulling the 10-year yield down to about 5.10%. Lower yields make borrowing cheaper and take some pressure off stocks.
Oil Is Knocking on $100 Again

- The noise: Brent crude fell about 2% early Monday after President Trump waived some sanctions on Russia tied to its diesel exports.
- The signal: the Strait of Hormuz is effectively shut. Two ships made it through on Oct. 11, per the IMF’s PortWatch tracker, against about 85 on a normal day.
U.S. crude settled at $99.02 a barrel Friday, its highest since Sept. 17. Brent closed at $109.86, its highest since May.
Treasury Secretary Scott Bessent has already tied September’s inflation to the energy shock.
For beginners: oil reaches your wallet through gas prices and shipping costs. If it stays near $100, it’s the thing most likely to keep a December hike on the table.

Featured Contributor
Today’s featured piece is from Tan Gera, Decentralized Masters’ co-founder and CEO, who writes The Macro Letter. Figures on 1987 come from the Federal Reserve’s history of the crash, the Brady Commission report, Berkshire Hathaway’s shareholder letters and reporting from the time. Dollar figures for today are price only, before dividends.
Nothing here is a recommendation.
Who Came Out Ahead on the Worst Day in Market History
Thirty-nine years ago this morning, a lot of people woke up to the worst day in stock market history. They just didn’t know it yet.
By the close on Oct. 19, 1987, the Dow had lost 508 points, or 22.6%. The S&P 500 fell 20.5%. About $500 billion in U.S. stock market value disappeared in one session.
For scale, the worst day of the COVID crash was a 12.9% drop. Black Monday was almost twice that.
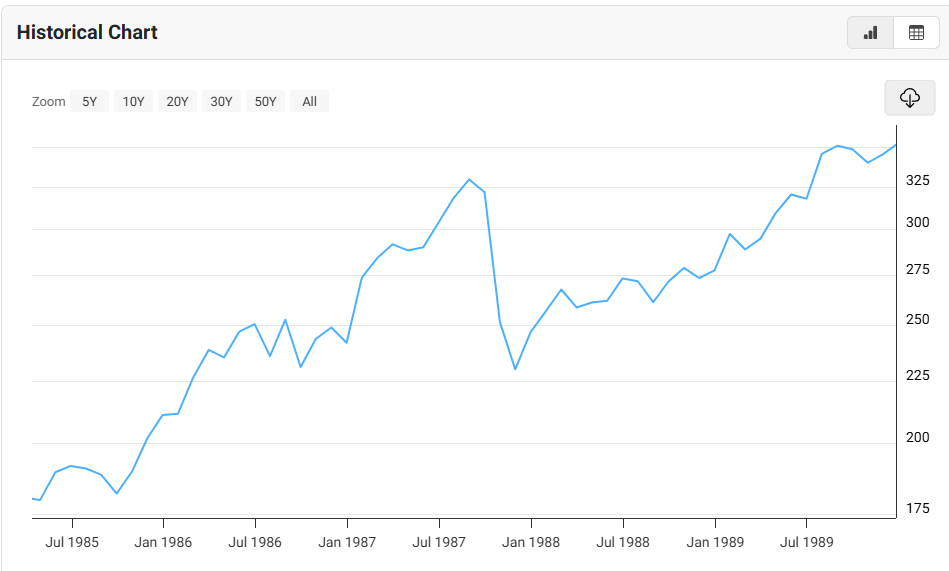
I want to talk about who came out ahead, because the answer surprises most people.
The ones who saw it coming
Paul Tudor Jones is the name everyone remembers. Months earlier, a documentary crew had filmed him laying the 1929 chart over 1987’s and arguing a break was coming.
When it came, his fund returned about 126% for the year after fees, per The New York Times.
Here’s the part that usually gets left out. His research director later admitted they’d fudged the comparison a bit by juggling the start dates. And the rest of the 1929 script never played out. 1988 was no 1930.
Elaine Garzarelli at Shearson Lehman called it too, on CNN, a week before. Her fund reportedly gained about 5% in the week of the crash.
Then about $700 million poured in. In 1988 it was the worst performer of its kind, and over the next three years it trailed the S&P 500 by about 43 percentage points.
The people who chased her call got the worst of both. They missed the crash, and then they missed the recovery.
The ones who sold
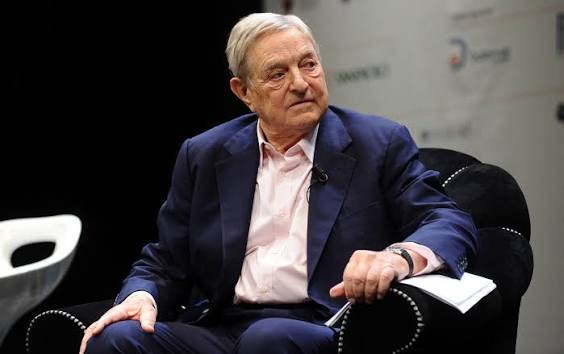
George Soros’s Quantum Fund lost heavily, reportedly as much as $800 million, much of it by selling near the low.
Portfolio insurance did damage too. It was a popular strategy that sold stock futures automatically as prices fell. The Brady Commission found those sales equaled more than 40% of futures volume that day. Automatic selling fed more selling.
The ones who held
Now the boring group. If you owned the S&P 500 at the start of 1987 and did nothing, you finished the year up about 5% with dividends. That’s after a 33% fall from peak to trough.
The index was back at its August 1987 high by July 1989. No recession followed.
Put $10,000 into the S&P 500 at the close on Black Monday and it’d be worth about $340,000 today, before dividends. Even at the August 1987 peak, the worst entry point that year, it’d be about $227,000.
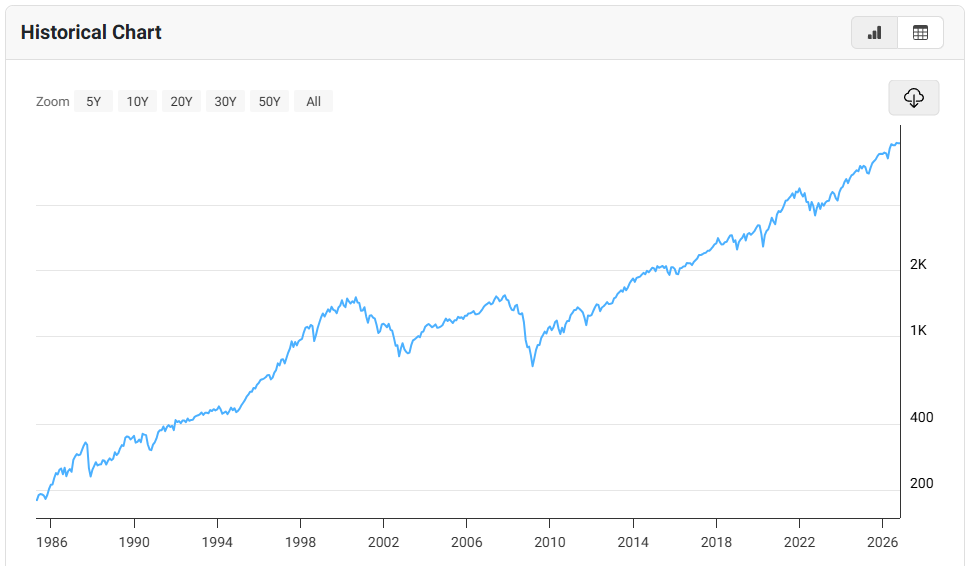
Two days after the crash, the Dow rose more than 10%. Anyone who sold on the 19th and waited for things to calm down missed that day.
That pattern didn’t end in 1987. J.P. Morgan found that over the 20 years through 2024, seven of the market’s 10 best days came within two weeks of its 10 worst. Miss those 10 days and a 10.4% annual return fell to 6.1%.
In August I wrote here about what reacting costs. In 2024, the average stock fund investor made 16.5% while the S&P 500 made 25%, per DALBAR. In 2025, a calmer year, that gap shrank to under one point.
The ones with a plan
In the two weeks after the crash, about 600 companies announced they’d buy back their own stock. GM, Ford and Citicorp were among the first, the very next day. They knew what their businesses were worth, and the price had just dropped.
Warren Buffett is the best example, and the timing matters. He didn’t buy in the panic. Berkshire Hathaway started buying Coca-Cola in 1988, months later, and spent about $1 billion on it over two years.
He bought a business he understood at a price he liked. In his 1988 letter, he wrote that Berkshire’s “favorite holding period is forever.”
None of these people needed to know Monday was coming. They’d already decided what to do if it did.
Why I bring it up this week
Last week the Nasdaq had its worst week since June, and over the weekend “Black Monday” was trending online. So let’s be fair about the comparison.
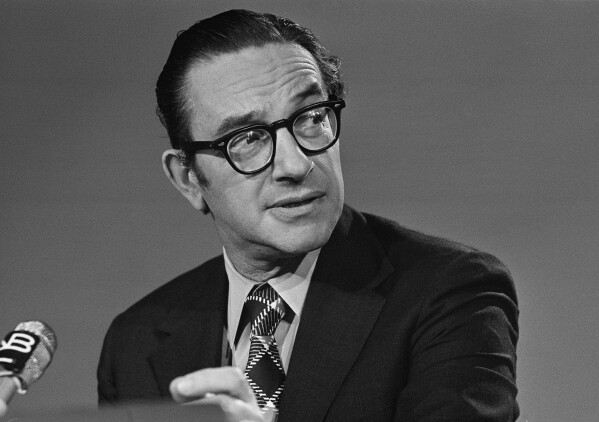
There are echoes I take seriously. Both years have a new Fed chief who raised rates in September. Alan Greenspan did it three and a half weeks into the job. Kevin Warsh did it at his third meeting. Both hikes came after a big run in a crowded trade.
The differences are bigger. In 1987, bond yields were climbing toward 10% and pulling money out of stocks. Last week, Treasurys had their best week since February.
And today there are circuit breakers that pause the whole market if the S&P 500 falls 7% or 13% in a day, and close it at 20%. None of that existed in 1987.
So I’m not calling a crash. I wouldn’t trust anyone who says they can time one.
Here’s what I do instead. I set my rules when things are calm: what I own, why I own it, where I add if prices fall and where I trim if they run. The mix covers growth, hard assets, a few asymmetric bets and enough stability that no single morning can force my hand.
I write those levels down every week in The Macro Letter, before the market gets to them. When a week like last week shows up, the decision’s already been made.
Very few people saw 1987 coming. The ones who came out ahead had a plan when it came, and that’s the part any of us can copy.
- Tan Gera
Co-founder and CEO, Decentralized Masters | The Macro Letter
Paid Advertisement
The Market Can Drop 22% in a Day. Your Portfolio Shouldn’t Have To.
The investors who survived 1987 owned more than one kind of thing, and had a plan before the open. The ABN system is how you build that: an all-weather mix meant to hold up in any market. Tan Gera lays out the full framework in a free training.
Disclosure: Decentralized Masters is a paid partner of Future Finance. The forecasts, track record and claims above are the views of Decentralized Masters, and do not represent the view of Future Finance. As always, do your own diligence. Educational content. Nothing in the training is a recommendation to buy or sell any asset, and all investing carries risk.
Final Thought
Anniversaries like this one get a lot more attention in a bad week.
Last week was a bad one for tech. For plenty else it was fine: the Dow rose for a second straight week, and bonds had their best week since February.
That’s the lesson inside Tan’s piece. The people who held in 1987 owned more than one kind of thing, and they’d decided in calm what they would do with it.
This week the AI trade gets its own test. Netflix reports Tuesday after the close, then Meta and Tesla on Wednesday. The Fed stays silent until its Oct. 28 decision, so the earnings will do the talking.
We’ll go through the results as they land. See you tomorrow.
Editor in Chief | Future Finance
One Subscription. The Entire Gems Uncovered Research Library.
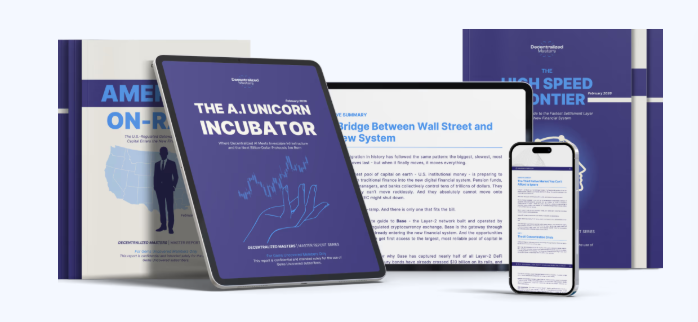
You just read why the surface of the news rarely tells the whole story.
Gems Uncovered is built on that same principle. It’s our weekly research briefing on early-stage assets and native market access, the opportunities that build real wealth before they ever reach a mainstream exchange.
One level beneath the headlines is where the edge lives.
Disclaimer: This content is not financial advice, it is for informational purposes only. All investments involve inherent risk. Any financial decisions you make are solely your responsibility.
Latest


Editor's Picks

Become a sharper capital allocator in 5 minutes a day.
Institutional-grade research on where the smartest capital is positioning, across AI, energy, biotech, robotics, and digital assets. Distilled into a daily read you finish before your coffee does.
Join 45,000+ readers · No spam · Unsubscribe anytime · No card needed