Why 90% of Your Returns Have Nothing to Do With Your Investments
The one force that moves every market, and how to track it yourself for free
June 8, 2026
·
6 min read


The briefing serious investors read first.
Free analysis before markets open. Start thinking in decades, not days.
Join 4,500+ readers · No spam · Unsubscribe anytime
The tide nobody tells you to watch
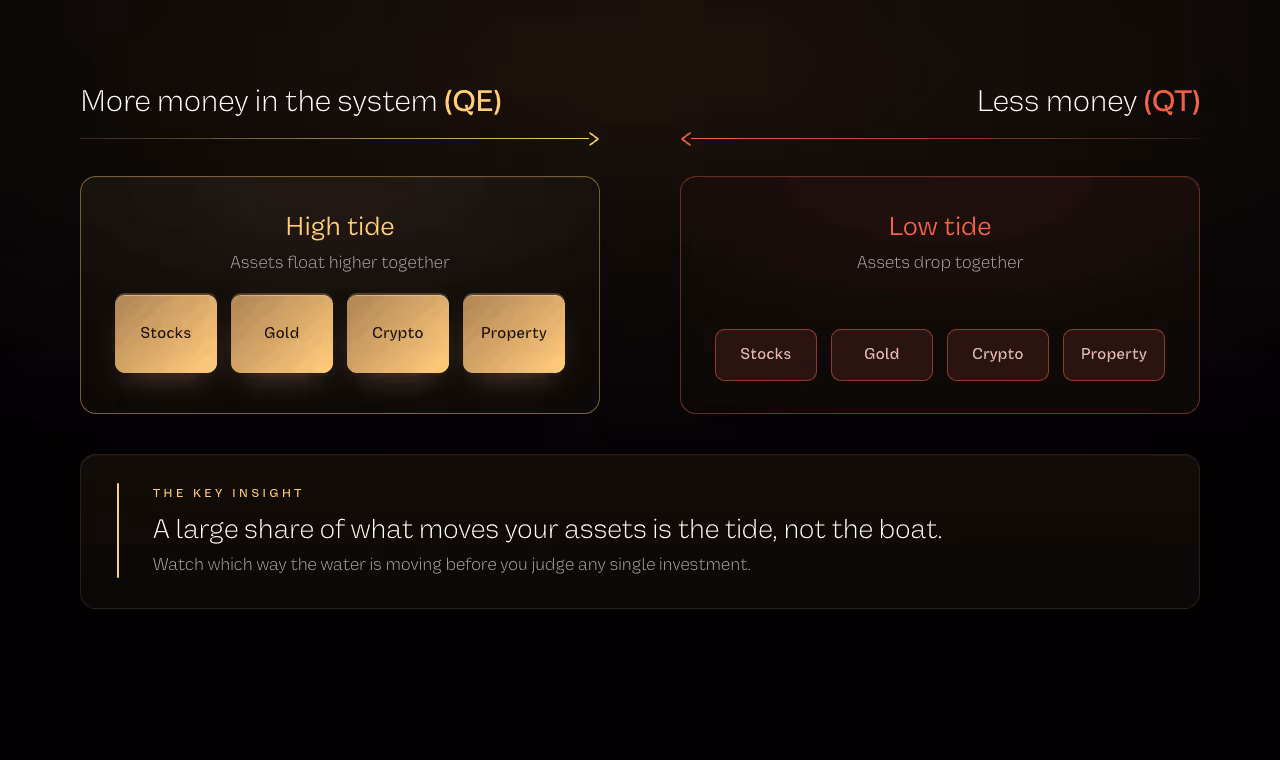
Picture a harbor full of boats.
Some are sleek yachts. Some are rusty fishing trawlers. Some are barely seaworthy.
When the tide comes in, every boat rises. The yacht and the leaky trawler both float higher, and for a while it is genuinely hard to tell which is which.
When the tide goes out, every boat drops. And only then, as the water drains away, do you find out who was sitting on a solid hull and who was about to sink.
Markets work the same way. The boats are stocks, gold, real estate, crypto, bonds, all of it. And the tide has a name.
It is called liquidity.
Liquidity is just the total amount of money sloshing around the financial system, looking for somewhere to go. When there is more of it, the tide rises and almost everything floats higher. When there is less, the tide pulls back and almost everything struggles.
Here is the uncomfortable truth most people never learn. A huge share of what moves your investments has very little to do with the investments themselves.
It has to do with the tide.
But here's what everyone is missing in the headlines…
While the financial news spends all day debating one company's earnings or one coin's upgrade, the single biggest force in the room, the tide itself, barely gets mentioned. Once you learn to watch it, the market stops looking random.
This report will teach you what liquidity is, where it comes from, why it matters more than almost any headline, and, most importantly, how to track it yourself using free tools you can open in a browser today.
Where the money actually comes from
So if liquidity is the tide, what controls it?
Mostly, central banks. In the United States, that is the Federal Reserve, usually just called "the Fed." Think of the Fed as the entity with a hand on the tap that controls how much money flows into the system.
The Fed has two main ways to turn that tap.
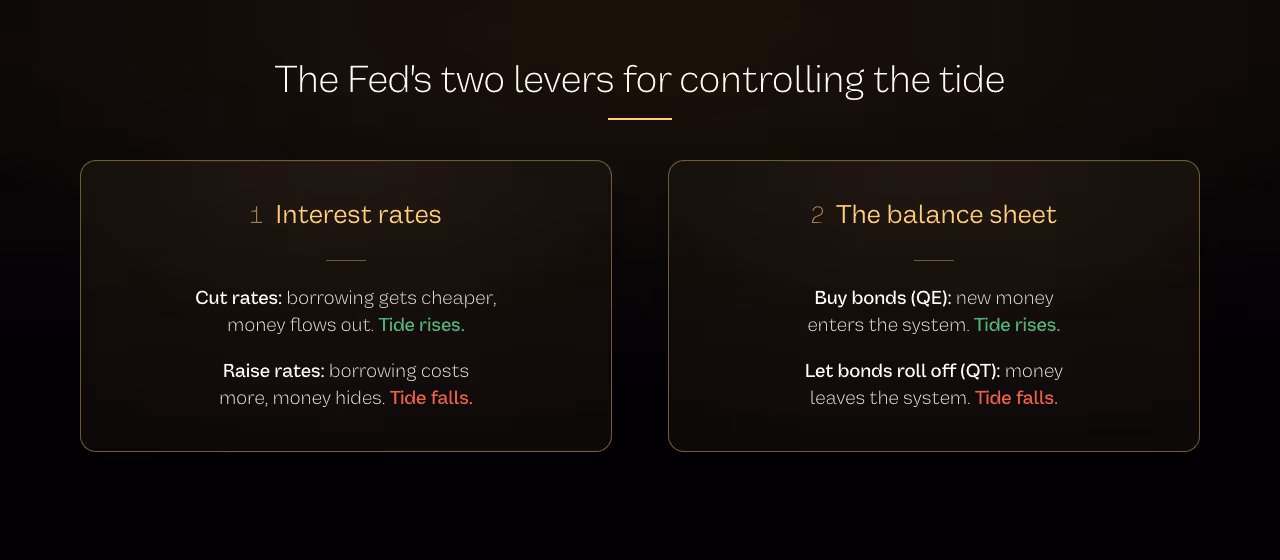
The first is interest rates. When the Fed cuts rates, borrowing gets cheaper, and cheaper money tends to flow out into the world looking for a return. When it raises rates, borrowing gets expensive, and money tends to sit still or hide in safe places. Lower rates, rising tide. Higher rates, falling tide. That is the rough rule.
The second lever is the one almost nobody understands, and it is where the real action happens.
It is the Fed's balance sheet.
Stay with me, because this is simpler than it sounds, and it is the single most useful thing in this report.
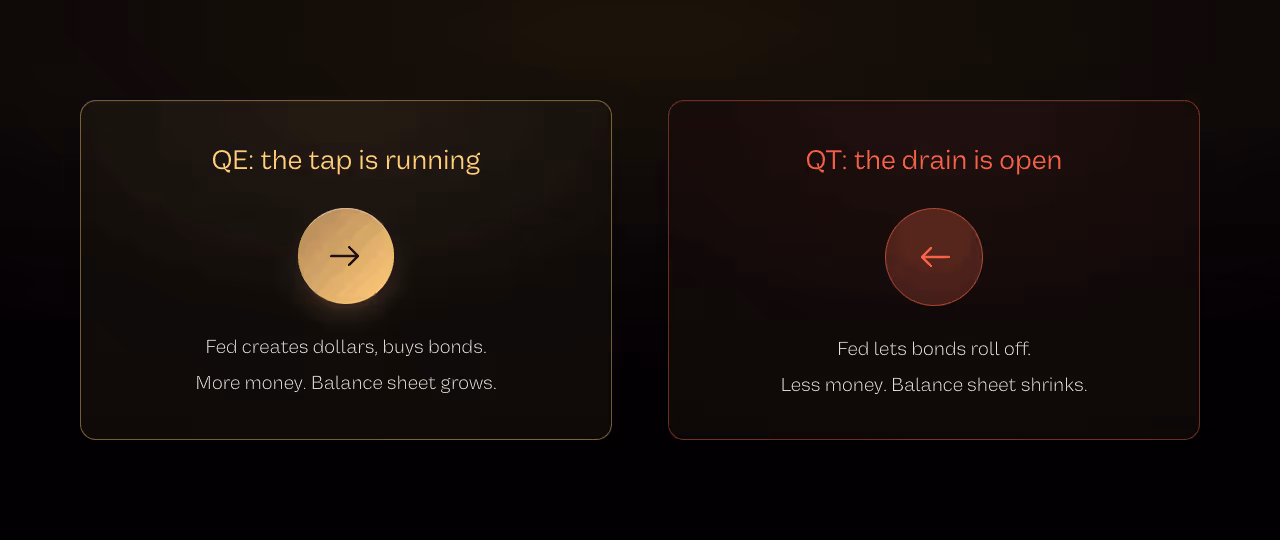
When the Fed wants to flood the system with money, it creates new dollars and uses them to buy bonds from banks. Those fresh dollars land in the financial system and go looking for a home. This is called quantitative easing, or QE. The Fed's balance sheet grows, and the tide rises.
When the Fed wants to drain money out, it does the reverse. It lets those bonds roll off and effectively pulls dollars back out of the system. This is called quantitative tightening, or QT. The balance sheet shrinks, and the tide falls.
QE is the tap running. QT is the drain open. That is the whole concept.
One honest caveat worth knowing. The headline balance sheet number is not a perfect measure of how much money is actually circulating, because a few other plumbing accounts can offset it. We will give you a cleaner gauge in the practical section. But as a starting mental model, "balance sheet up means more money, balance sheet down means less" gets you most of the way there.
Why this beats almost every headline
Here is why the tide matters more than the boats.
When a great deal of new money enters the system, it rarely flows evenly into the real economy. People do not suddenly buy ten times more bread. So the money goes hunting for assets instead, things that cannot simply be printed: stocks, gold, property, scarce digital assets.
That is why, in a rising-liquidity environment, you often see stocks, gold, and crypto all climbing at once, even when their individual stories have nothing to do with each other.
It is not that all these assets suddenly got better on the same Tuesday.
It is that the thing you measure them in, the dollar, is becoming more plentiful. More money chasing the same limited pile of assets pushes prices up.
History makes the pattern hard to miss.
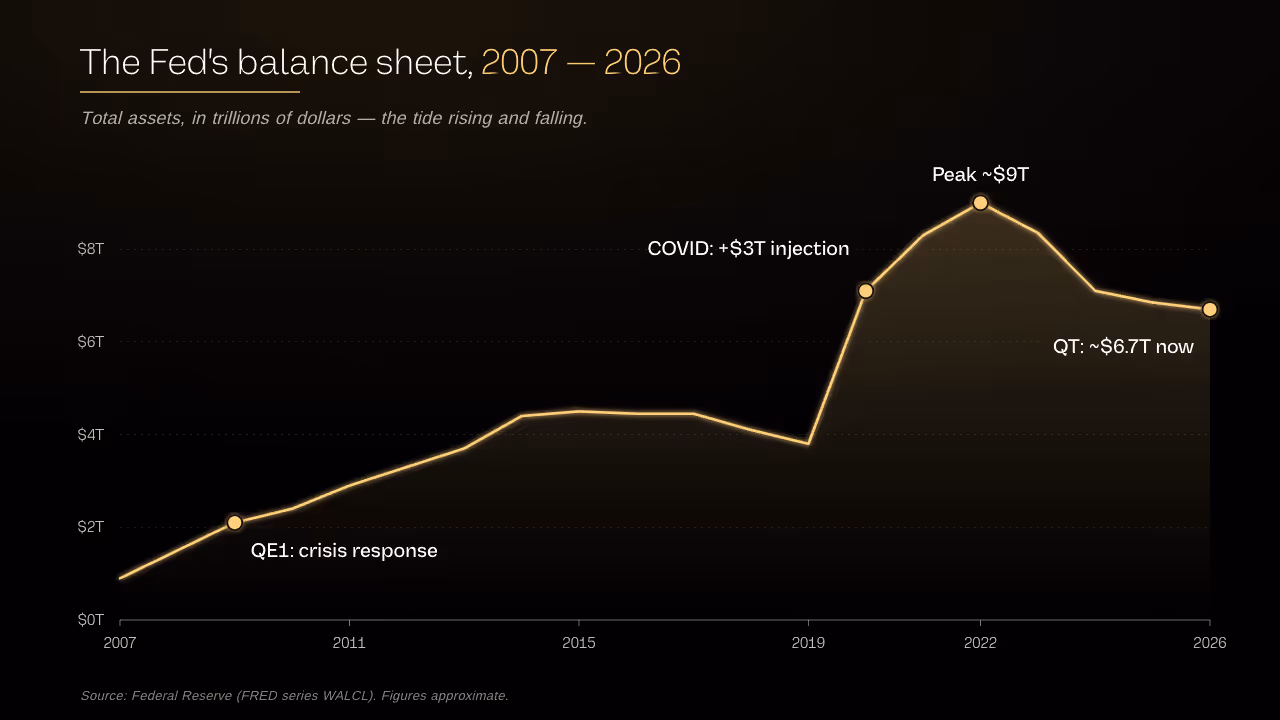
In late 2008, during the financial crisis, the Fed turned the tap to full. Over the years that followed, the stock market staged one of the great recoveries in its history. A striking share of the strongest stretches in that recovery happened while the Fed's money tap was actively running.
In 2020, the Fed responded to the pandemic with the fastest, largest money injection ever attempted. Risk assets bottomed almost the exact week the Fed announced unlimited support, then ran for the next eighteen months.
And the reverse holds too. When the Fed has pulled the tide out aggressively, even good assets have struggled, not because anything broke, but because the water left the harbor.
There is one more pattern worth burning into memory, because it is where attentive people position early.
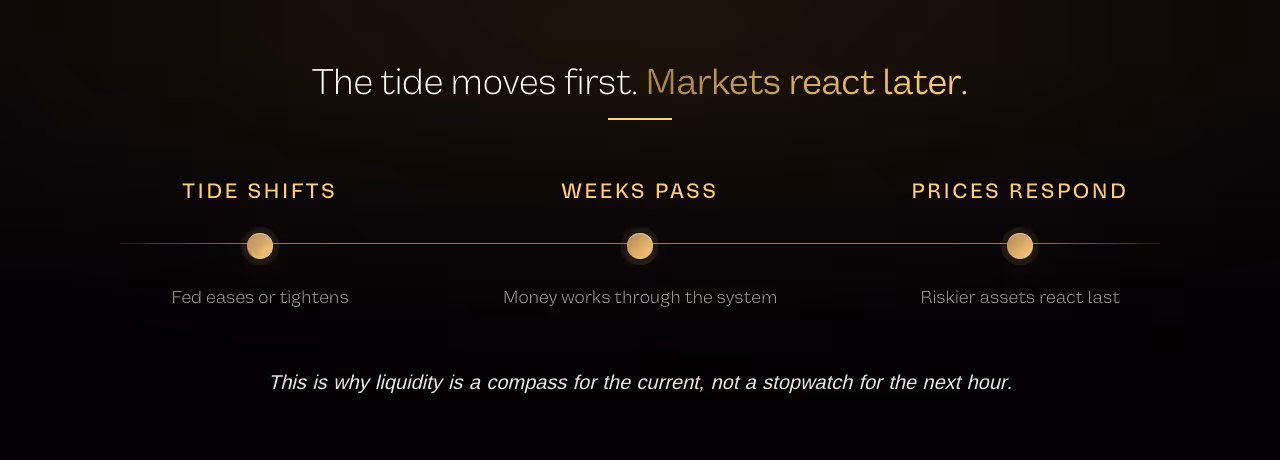
Markets move on the expectation of a tide change, not the event itself.
In 2019, the Fed signaled it would stop draining money months before it actually eased. Markets did not wait. They began rising on the promise alone, and by the time the easing actually arrived, much of the move had already happened.
The lesson: by the time a tide change is obvious in the headlines, the smart money has usually already acted. Watching the signals yourself is how you stop being last to know.
A word on the boats
None of this means the individual boat does not matter.
Over the long run, the quality of the hull is everything. A great business compounds through good tides and bad. A weak one gets exposed the moment the water drops. The tide decides who floats today; the hull decides who is still floating in ten years.
So liquidity is not a replacement for judgment about what you own. It is the context around it. It tells you whether you are swimming with the current or against it, which is useful to know before you get in the water.
And it offers a quieter, more durable lesson. When the tide is high and everything is floating, it is worth remembering that the water will eventually go out, and asking yourself honestly which of your boats has a solid hull.
How to track the tide yourself, for free
This is the part you can act on the moment you finish reading.
Everything below uses public data, most of it published by the Federal Reserve itself, and all of it free. You do not need a subscription or a trading account to look at any of it.
1. Watch the Fed's balance sheet.
This is the master tap. The Federal Reserve Bank of St. Louis publishes it on a free database called FRED, updated weekly. The series is named "Total Assets," ticker WALCL.
Open the Fed balance sheet chart on FRED.
What to look for: is the line generally rising (tap running, QE) or falling (drain open, QT)? You do not need to predict the exact level. You only need to know which direction the tide is moving.
2. Watch the cleaner "net liquidity" gauge.
Remember that caveat about plumbing accounts offsetting the headline number? Two accounts in particular, the Treasury's checking account and an overnight facility called reverse repo, can pull money out of the system even when the balance sheet looks flat. Subtracting them gives a truer read.
The simple formula many analysts use: Fed balance sheet, minus the Treasury General Account, minus reverse repo.
You can build this exact chart for free on FRED's graphing tool, or on a free charting site like TradingView, by combining these series: WALCL minus WTREGEN minus RRPONTSYD.
The two accounts to subtract: the Treasury General Account and the overnight reverse repo facility.
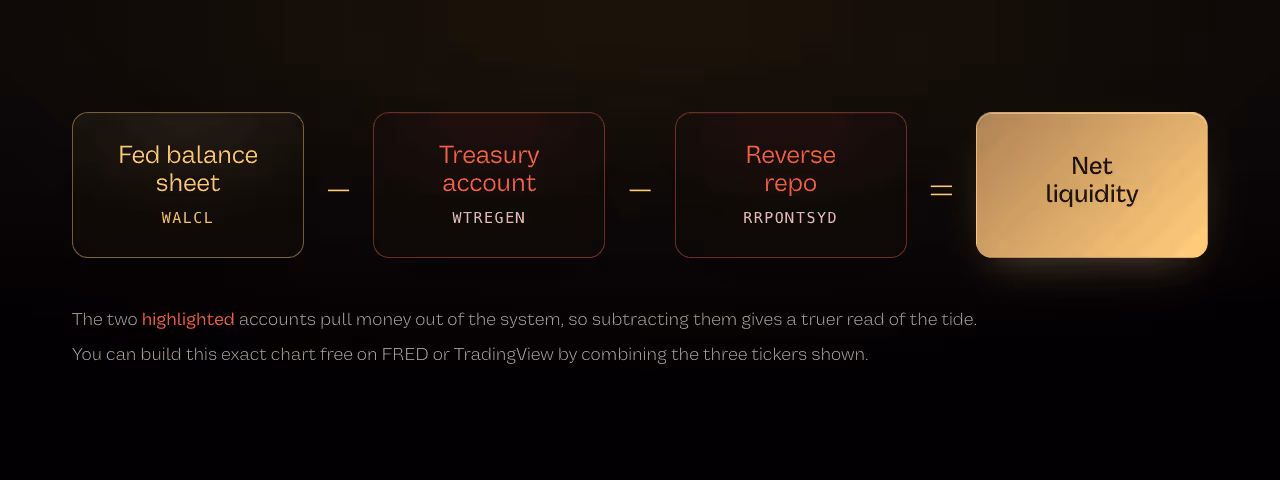
What to look for: the same thing, direction. Is net liquidity rising or falling?
3. Watch the broad money supply.
A measure called M2 tracks the total pool of money in the economy, cash plus the money in everyday accounts. It is a slower, bigger-picture gauge of the tide.
Find the M2 money supply chart on FRED.
For the global picture across the major central banks, free trackers like MacroMicro and StreetStats publish a combined global M2 chart, since the Fed is not the only tap that matters.
What to look for: is the long-term line still grinding higher, and is the pace speeding up or slowing down?
4. Watch interest rates and what the Fed says next.
The direction of interest rates, and the Fed's own hints about where they go next, shape the tide months ahead. The Fed publishes its schedule and statements for free.
See the Fed's meeting calendar and statements.
What to look for: is the Fed signaling easier money ahead (supportive) or tighter (a headwind)? Remember the 2019 lesson, the signal often matters more than the act.
A note on timing, so you have realistic expectations. Liquidity does not move markets the same day. There is usually a lag, often weeks, sometimes longer, between a shift in the tide and the full effect on prices. Riskier, more speculative assets tend to react later than the steadier ones. So this is a tool for understanding the current you are swimming in, not a stopwatch for timing the next hour.
Where things stand as you read this
To make the tools concrete, here is a rough snapshot of the gauges as of mid-2026. Treat these as a starting point and check the live links above, because the whole point is that these numbers move.
The Fed's balance sheet sits near $6.7 trillion, down from a peak around $9 trillion, as a long stretch of draining slowly winds down.
The reverse repo account, one of those offsetting plumbing accounts, has drained to nearly zero, after sitting above $2 trillion a couple of years earlier. That drainage quietly cushioned the system even while the headline balance sheet was shrinking, which is exactly why the net-liquidity gauge is worth watching.
The broad US money supply, M2, has climbed back to around $22.7 trillion and is grinding higher again after a rare contraction in 2022 and 2023.
Put together, the picture is of a tide that pulled back hard, then steadied. Whether the next big move is in or out is the question every serious investor is watching, and now you can watch the same gauges they do.
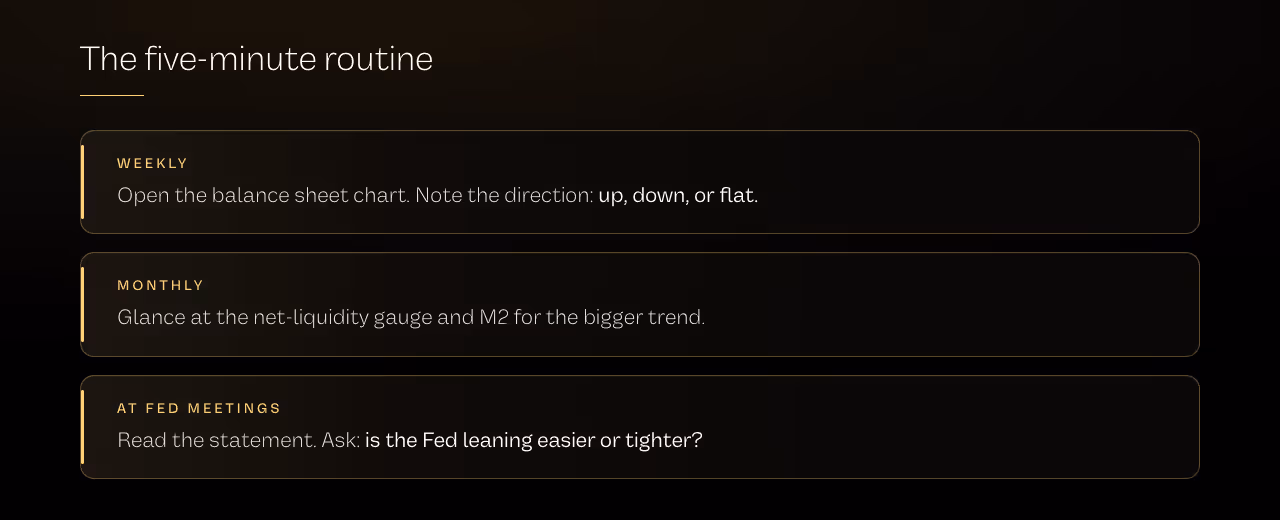
The five-minute routine to make this a habit
You do not need to stare at these charts all day. A short, regular check is enough to keep your bearings.
Once a week or so, open the balance sheet chart and note the direction. Up, down, or flat.
Once a month, glance at the net-liquidity gauge and the M2 chart for the bigger trend.
Around the Fed's scheduled meetings, read the short statement, or a plain-language summary of it, and ask one question: is the Fed leaning toward easier money or tighter?
That is the entire routine. Direction, trend, and the Fed's lean. Do that consistently and you will understand the single biggest force acting on your portfolio better than most people who talk about markets for a living.
The one idea to take with you
If you forget everything else, keep this.
Before you ask whether an individual investment is good, ask which way the tide is moving. The boat and the tide are two different questions, and most people only ever think about the boat.
Watch the tide, respect the lag, and never forget that when the water is high and everything floats, the hull still decides who is swimming when it goes back out.
That is how you read the liquidity cycle. The gauges are free, the patterns are knowable, and you can start today.
- Rami Al-Sabeq (Editor in Chief | Future Finance)
About Future Finance
Future Finance is written by Rami Al-Sabeq, Editor-in-Chief, and his research team. His macro-to-crypto work has been featured in Unchained and Cryptonary, and his independent essays appear at RamiWrites.Substack.com.
Behind every issue sits Head of Research Tyler Hubbard, whose track record across 590+ digital asset picks has produced an 85% directional accuracy rate and a 426% average peak return. That's as of the third-party audit measuring performance through April 30th, 2026. Follow him on TradingView here.
Latest


Popular
The briefing serious investors read first.
Free analysis before markets open. Start thinking in decades, not days.
Join 4,500+ readers · No spam · Unsubscribe anytime